An important attribute shared by most value investing approaches is the
rational perspective of taking a long-term view. This is critically
important, because it is all too common that undervalued common stock
investments do not tend to perform well over the short run. This is
simply because, as a general rule, you will not find undervalued
investment opportunities in popular stocks (companies). Common sense
dictates that stocks only tend to become undervalued when they are
simultaneously unpopular, at least temporarily. It is generally this
unpopularity that creates the short-term discrepancy between fundamental
value and stock price.
However, the greatest success derived from value investing happens
when the company’s stock price is dropping even when the fundamentals of
the company continue to remain strong. Therefore, the key to
implementing a profitable value investing transaction is to learn to
focus on and trust the fundamentals supporting the business. In the same
context, this also means adopting the conviction to not trust, and even
the willingness to ignore poor short-term price action. Accomplished
value investors understand that stock prices can lie, at least over the
short run. But more importantly, accomplished value investors also
understand that in the long run, fundamentals matter most.
Consequently, successful value investing requires a level of patience
that unfortunately many short-term oriented investors do not possess.
However, the rewards from investing in a truly undervalued stock can
produce powerful long-term returns for the rational value investor who
is capable of engaging in intelligent patience. But even better yet,
those powerful long-term returns are generated at reduced levels of risk
relative to other common stock investing strategies.
-- Chuck Carnevale
Friday, November 20, 2015

Thursday, November 12, 2015
Jeff Bezos now fourth richest
Jeff Bezos has jumped past Carlos Slim on Bloomberg's Billionaires Index, making him the fourth-richest person in the world thanks, in part, to a 113-percent rally in Amazon.com Inc. this year.
Monday, November 09, 2015
traits of great investors
Trait No.1 is the ability to buy stocks while others are panicking and sell stocks while others are euphoric. Everyone
thinks they can do this, but then when Oct. 19, 1987 comes around and
the market is crashing all around you, almost no one has the stomach to
buy. When the year 1999 comes around and the market is going up almost
every day, you can’t bring yourself to sell because if you do, you may
fall behind your peers. The vast majority of the people who manage money
have MBAs and high IQs and have read a lot of books. By late 1999, all
these people knew with great certainty that stocks were overvalued, and
yet they couldn’t bring themselves to take money off the table because
of the “institutional imperative,” as Buffett calls it.
...
And finally the most important, and rarest, trait of all: The ability to live through volatility without changing your investment thought process. This is almost impossible for most people to do; when the chips are down they have a terrible time not selling their stocks at a loss. They have a really hard time getting themselves to average down or to put any money into stocks at all when the market is going down. People don’t like short-term pain even if it would result in better long-term results. Very few investors can handle the volatility required for high portfolio returns. They equate short-term volatility with risk. This is irrational; risk means that if you are wrong about a bet you make, you lose money. A swing up or down over a relatively short time period is not a loss and therefore not risk, unless you are prone to panicking at the bottom and locking in the loss. But most people just can’t see it that way; their brains won’t let them. Their panic instinct steps in and shuts down the normal brain function.
Saturday, October 24, 2015
Bogle looking at a 4% total return for stock
Benz: Jack, one of the topics we always cover at this conference is your expected return forecast for various asset classes. Let's start with U.S. equities.
Bogle: Well, for U.S. equities, I have a simple formula, as you know. It says divide it up into two segments: One is investment return and the other is speculative return. Investment return is the present dividend yield--a little over 2%--and the earnings growth that follows. And I think it's going to be a little bit of a push for that earnings growth to get to 6%--but I'm going to use 6%. So, that would be an 8% investment return on stocks.
Now, when you get to speculative return, that's whether the P/E ratio go up and pump that up or go down and deflate it. And I look at the P/E from the perspective of past reported earnings--GAAP earnings, as we say it--at being about 20 times. Wall Street looks at it through forward earnings, but forward expected earnings. So, they're using about a 17 P/E, and I'm using about a 20. I'm going to stick to my guns. To go from 20 to 17, that would be about a 2% annual loss. So, I think the best thing we can expect--and this is higher than I'm going to talk about tomorrow--is that 8%, [or 2% dividend yield and 6% earnings growth]. But in fact, I don't think earnings growth is going to be that good, and so I think the P/E could easily get to a more normal long-term range of 15. So, that would be 3% from that number. So, you'd have an investment return of 2% and 5% for 7%, minus 3% for speculative return. That would be 4% for stocks, and that's not a very good number.
Friday, October 23, 2015
no. 3 in America: Jeff Bezos
A 10% bump in Amazon's stock price in after-hours trading following a positive earnings report Thursday made a lot of people a little richer — and CEO Jeff Bezos a whole lot richer.
According to the Bloomberg Billionaire Index, the leap in Bezos' Amazon stock increased his fortune by almost $5 billion Thursday evening, making him the third-wealthiest person in the United States and the fifth world wide.
At the beginning of the year he was only the 13th wealthiest American, according to Bloomberg.
Bloomberg put Bezos' current net worth at $55 billion. That leaves only Bill Gates, with $83.9 billion and Warren Buffett, with $64.5 billion, ahead of him.
The stock move pushed the Koch brothers, Charles and David, to fourth and fifth place.
Bill Gates is no. 2
There's a new richest man in the world.
It's Spanish clothes magnate Amancio Ortega, who has overtaken Microsoft founder Bill Gates for the first time ever.
According to Forbes' real-time tracker, the elusive multi-billionaire founder of European clothes retailer Zara just smashed past Bill Gates to become the wealthiest person on the planet, with a fortune of $79.8 billion (€71.83 billion or £51.84 billion).
The elusive Ortega isn't as much of a household name as Gates, but he's quietly ascended the wealth rankings in recent years, as his company continues to perform well and expand.
Unlike many of the richest people in the world, Ortega has a fascinating rags-to-riches story. Born in 1936 during the Spanish civil war, Ortega's father earned 300 pesetas a month, a meagre salary.
Ortega's biographer described his memories of a childhood during which his family could not always afford enough food. He left school in his early teens, working his way up from the absolute bottom rung as a messenger boy in a shop.
It wasn't until he was 40 years old that Ortega got around to setting up Zara, the fast-fashion retailer that has gone from strength to strength — first growing in Spain, then neighbouring Portugal and France, then London. Now it's all over the globe.
According to Forbes, Ortega's wealth rose by 5.3%, another $4 billion, over the last 24 hours. That's partly down to a surge in Inditex shares, the parent company that owns Zara.
In the last 10 years, the market value of Inditex has risen by about 570%, the main driver of Ortega's climb up the ranks.
Tuesday, October 20, 2015
in search of the stock market bubble
So, (the sentence starts with "so" because this is a sort of ongoing
discussion that's been going on here for years) I've been thinking about
the overall market again. Despite my telling people to ignore this and
ignore that, I can't help it; sometimes I think about this stuff.
Well, it's OK to think about it as long as it doesn't lead to
irrational decisions.
Anyway, as usual, there is a lot of talk of the market being insanely overvalued, median P/E's at post war records and all the usual.
I look at the charts and some are scary, but I still don't get the sense of a bubble. I've seen the Japan bubble in 1989, the 2000 internet bubble and some others. I see the Chinese bubble going on right now. But I still don't really get the sense that the U.S. stock market is in a bubble. Yes, there is a pocket of bubbliness, like in some parts of the tech sector (social networks, biotech etc.), but overall I just really don't see it.
I made a post just like this one two or threes years ago when people were saying the market is overvalued. I looked up the P/E ratios of the Nifty Fifty stocks in 1972 to see what a real bubble looks like.
What is really interesting to me here is that the S&P 500 index P/E ratio at the time was 19.2x. But look at the nifty fifty P/E ratios. To me, this is what a bubble looks like. These 'ordinary' companies were trading at higher P/E's than high growth social network stocks or fast casual restaurant chain today!
People say that the market is tremendously overvalued. Is the market so overvalued that I would be comfortable with a massive short position? I just imagine myself with a big short position to see how I would feel. What do I need to make money? What can go wrong? Is there really a big margin of safety in terms of valuation; are things so overvalued that it's a no brainer to be short? At this point, I would not be comfortable short at all. Sure, earnings for everyone might be bloated due to QE-infinity and budget deficits. There are other reasons to be bearish, but I just don't see it from a valuation point of view. The market is certainly not cheap. But it's not so expensive that it's a no-brainer short either.
I've been saying this sort of thing since 2011 when I first started this blog; that the market is fine. But sooner or later the bull market will end. The market will tank and people will go back and read these posts and have a good laugh. I know that will happen for sure. But that's OK.
I'm not trying to predict anything, nor am I saying that we won't have another bear market again. The market will go down for sure, 50% or more. There is no doubt about that at all. But I don't know when that will happen.
-- The Brooklyn Investor, June 16, 2015
***
Blodgett says market is more expensive than 2000 and sees a decade or more of lousy returns. [via chucks_angels]
Saturday, October 10, 2015
why investors underperform the market
The stock market has averaged compound total returns of about 9% a year over the last 100+ years. This means a doubling of your money about every eight years.
When your money doubles every eight years on average you will eventually become very wealthy. And that’s only if you match the market returns. Surely, some investors should beat this "average" return by a substantial amount. So why aren’t there more rich and ultra-rich investors if it really is that easy?
The sad truth
The sad truth is, it is not that easy.
On paper, investing is very simple. But we don’t live on paper.
Real-life investors (unless you are a robot, that is you) greatly underperform the market.
Case in point: Over the last 20 years, the Standard & Poor's 500 has averaged 9.2% annual returns.
Individual investors have averaged returns of 5.0% a year over the same time period according to the 2014 DALBAR QAIB Study.
There is no reason at all individual investors should greatly underperform the market – but they are.
The most important investing risk is you
The reason individual investors fail to beat – or even match – the market is because we fail to follow a consistent strategy when times get tough.
Simply put, we panic.
Wednesday, September 09, 2015
Charles Schwab Onward Magazine
Schwab is mailing this magazine to me (actually to my mom) for free. But don't see if or where it's getting archived. So I'm putting the links that I managed to find here.
It used to be called OnInvesting, but has been retitled Onward. There's a few issues I found in pdf form, but it also looks like (most of?) the articles are also online, though they're not really attributed to being in a particular issue.
Fall 2015
Five Retirement Planning Myths
Time In, Not Timing
Summer 2014 (couldn't find the entire issue online, but found this article which was in the magazine)
Awash In Data
Winter 2014
Fall 2014
Winter 2013
Sunday, September 06, 2015
like 1998?
If you’re nervous about where the market is headed (after enduring two
eyebrow-raising weeks of pronounced volatility) then guess what - you’re
normal. Human nature is to fear losses, and memory of the 2008 bear
market still lingers. Nobel Prize-winning psychologist Daniel Kahneman
discovered that investors dislike losses roughly twice as much as they
enjoy gains. Frankly, I think losses are despised even more than that.
It makes sense then that the current volatility has many questioning the sustainability of this bull market. The knee-jerk reaction is to sell stocks and ride-out volatility from the sidelines. But, I think that’s the wrong move and I still see this current volatility as a short-term market correction, not a bear market. To me, this market is looking more and more like 1998 than 2008.
4 Reasons I Think This Market is More Like 1998 Than 2008
Many investors won’t remember this, but in 1998 the market took a steep dive from mid-July to mid-October, falling slightly more than 19% in total.
But in 1998, the market did what it classically does in a correction – it falls quickly and steeply, posts a mini-recovery mid-way through (kind of what we’re seeing now), and then it falls quickly again until the correction finds its bottom. From there though, the market powers through to a very swift recovery, which in 1998 meant climbing some 28% from mid-October to the end of the year. Investors that got spooked out of the market given that volatility would have been majorly whip-sawed. My advice: don’t be that investor.
Indeed, I see a similar pattern forming today. I wouldn’t be surprised if the market continues bouncing higher after big down days, luring investors to believe the correction is over when in fact there is still more downside left. But that’s ok! We’re only about three weeks into this downside volatility, and corrections can last anywhere from a few weeks to a few months. Investors should brace for continued volatility, but not fear it. I still think fundamentals point to more secular upside from here, and this downside volatility should be short-lived with a quick recovery in the wings – just like 1998.
Here are four similarities I see between 1998 and today:
1) Late Stage Bull Market – 1998 was the eighth year of a ten year long bull market, and 2015 marks the 6th year of our current bull market. A lot of folks think this is too long to be in a bull market, but that’s a false thought – bull markets since the Great Depression have lasted an average of 8 or so years, meaning for this one to last two more years would be quite normal.
2) Concerns over Asian and Emerging Market Currencies – at present, many are worried that the strengthening dollar is going to doom Emerging Markets [EM], especially if you tack-on lost revenues due to falling commodities prices (since many EM countries are energy and mineral exporters). A strengthening dollar also hurts EM countries because their debt is almost universally denominated in dollars, meaning that a strong dollar equates to more costly interest payments. All very true. Interestingly though, the same scenario occurred in 1997, when global markets rattled over the Asian currency crisis. Countries like Thailand, Indonesia, and South Korea rapidly saw their currencies fizzle in value, and experts predicted a complete collapse in the global markets. But it didn’t happen. The stock market corrected then and there was a carry-over into 1998, but it wasn’t enough to send equities into a prolonged downturn. The China economy concern (and currency devaluation) of today shouldn’t either.
3) Interest Rate Hikes Looming – as it turns out, 1998 was the precursor to a series of interest rate hikes by the Federal Reserve – just like 2015 seems to be. From 1999 – 2000, the Fed raised interest rates six times from 4.75% to 6.50%, but the market also annualized 5% over the same period! For everyone that fears interest rate hikes by the Fed, all they need is a history lesson: stocks have done remarkably well during the past three rate hike cycles.
4) Optimism Building, but Not Fully Developed – there’s no quantitative evidence to support this, but my general feeling is that investors aren’t entirely comfortable with this bull market. In my view, there has to be some level of unjustified optimism about stocks in order for me to believe they are overpriced. And I just don’t see that today. In my opinion, stocks thrive on skepticism – they love to climb that ‘wall of worry.’ And that wall very much exists today, especially now.
Bottom Line for Investors
Many are tempted to think that this market’s volatility is somehow unprecedented, and the media are quick to spin the downside. But that is simply the wrong way to think. The market has endured steep quick declines in the past (1998, 2011) and recovered briskly at a moment’s notice. I think the same applies to the current scenario, and that investors should hold their breath a bit and remain patient. Downside volatility is scary, but often times it’s just temporary. I think it is this time too.
-- Mitch Zacks, Market Insights, Zacks Investment Management
Saturday, September 05, 2015
playing it "safe"?
Just as few foresaw the long bull market, few anticipated the recent
downturn. Sure, there are people who have predicted 17 of the last three
sell-offs, and who will claim to have called this one, too. Nope.
Huddling in a tent for several years straight, then leaping up to
exclaim "Aha!" when the thunder finally sounds, does not a rain doctor
make.
This collective fog makes post-crash interviews excruciatingly dull. Stay the course. Hold tight. Don't give in to your emotions. The bromides are mind-numbing. But they are correct, in that it is no easier to predict the market's recovery than it is its decline. This chart from FiveThirtyEight shows the results for a theoretical investor who moved to cash whenever stocks fell by at least 5%, then got back in once they recovered by at least 3%. Not pretty.
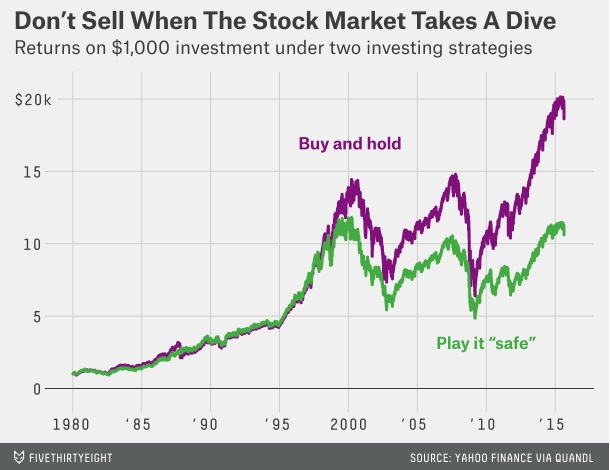
So one would think the inverse would be true. Buy when stocks fall by 5% (to simplify it.)
This collective fog makes post-crash interviews excruciatingly dull. Stay the course. Hold tight. Don't give in to your emotions. The bromides are mind-numbing. But they are correct, in that it is no easier to predict the market's recovery than it is its decline. This chart from FiveThirtyEight shows the results for a theoretical investor who moved to cash whenever stocks fell by at least 5%, then got back in once they recovered by at least 3%. Not pretty.
So one would think the inverse would be true. Buy when stocks fall by 5% (to simplify it.)
Thursday, August 27, 2015
a historic sell-off
By one metric, investors would have to go back 75 years to find the last time the S&P 500's losses were this abrupt.
Bespoke Investment Group observed that the S&P 500 has closed more than four standard deviations below its 50-day moving average for the third consecutive session. That's only the second time this has happened in the history of the index. May 15, 1940, marked the end of the last three-session period in which this occurred:
This string of sizable deviations from the 50-day moving average is a testament to just how severe recent losses have been compared to the index's recent range.
"Not even the crash of 1987 got this oversold relative to trend," writes Bespoke.
The money management and research firm produced a pair of analogue charts showing what's in store if the S&P 500 mimics the price action seen in mid-1940. Overlaying the axes gives the impression that the worst of the pain is behind us, and a market bottom isn't too far off:
However, indexing the S&P 500 to five sessions prior to the tumult shows that a replication of the mid-1940 plunge could see equities run much further to the downside and into a bear market:
If it tracked the 1940 trajectory, the S&P 500 would hit a low of 1,556 in relatively short order. But Bespoke doesn't think stocks are fated to repeat that selloff.
"There is nothing, nothing, we have seen - Chinese fears, positioning, valuation, or any other factor - suggests to us that we are headed to 1556," the analysts write. "More likely, in our view, is something along the lines of the top analogue; we doubt the bottom is in, but see it unlikely we enter a bear market and a true stock market crash."
Bespoke Investment Group observed that the S&P 500 has closed more than four standard deviations below its 50-day moving average for the third consecutive session. That's only the second time this has happened in the history of the index. May 15, 1940, marked the end of the last three-session period in which this occurred:
This string of sizable deviations from the 50-day moving average is a testament to just how severe recent losses have been compared to the index's recent range.
The money management and research firm produced a pair of analogue charts showing what's in store if the S&P 500 mimics the price action seen in mid-1940. Overlaying the axes gives the impression that the worst of the pain is behind us, and a market bottom isn't too far off:
However, indexing the S&P 500 to five sessions prior to the tumult shows that a replication of the mid-1940 plunge could see equities run much further to the downside and into a bear market:
If it tracked the 1940 trajectory, the S&P 500 would hit a low of 1,556 in relatively short order. But Bespoke doesn't think stocks are fated to repeat that selloff.
"There is nothing, nothing, we have seen - Chinese fears, positioning, valuation, or any other factor - suggests to us that we are headed to 1556," the analysts write. "More likely, in our view, is something along the lines of the top analogue; we doubt the bottom is in, but see it unlikely we enter a bear market and a true stock market crash."
Sunday, August 23, 2015
the richest who ever lived
Every year Forbes publishes the richest 500 people in the world. Bill Gates has topped that list for 16 of the past 21 years. His fortune sits at $79.2 billion dollars, which is larger than the size of Hawaii’s economy at $77.4 billion dollars in 2014!
Although Gates’ wealth is the highest today, how would he stack up against the history’s richest people? Below are history’s top 30 richest people at their peak wealth, adjusted for inflation and appreciation of their assets. You will also see the “Honorable Mention” list that shows rulers, monarchs, and emperors of countries that drew their wealth from the country they ruled.
Here are some interesting highlights for the richest people of all time, including the Honorable Mentions:
The Top 30 are worth about $5 trillion dollars! This amount is more than the size of Japan’s economy.
14 out of the 30 are Americans
None are women (for now at least!)
Only 3 are currently living but do not crack the Top 10: Bill Gates, Carlos Slim Helu, and Warren Buffett
Tuesday, August 18, 2015
destroying your ideas
“And one of the great things to learn from Darwin is the value of extreme objectivity. He tried to disconfirm his ideas as soon as he got ’em. He quickly put down in his notebook anything that disconfirmed a much-loved idea. He especially sought out such things. Well, if you keep doing that over time, you get to be a perfectly marvelous thinker instead of one more klutz repeatedly demonstrating first-conclusion bias”
-- Charlie Munger
Of all the mental models imparted by Charlie Munger (Trades, Portfolio), seeking disconfirming evidence is probably one of the hardest ones to implement due to human ego. Our tendency to justify away disconfirming evidence and to simply deny the existence of disconfirming evidence is strong, which makes actively seeking disconfirming evidence almost against human nature.
Keep in mind that the goal is not to seek disconfirming evidence for everything. You only need to seek disconfirming evidences for the most important things – the main drivers of your thesis – the factors that actually move the needle.
I’m going to end this article with another great quote from Charlie Munger (Trades, Portfolio):
"We all are learning, modifying, or destroying ideas all the time. Rapid destruction of your ideas when the time is right is one of the most valuable qualities you can acquire. You must force yourself to consider arguments on the other side."
Thursday, August 06, 2015
Behavioral economics
Behavioral economics should have been a boon for active investment
management. The argument for stock market efficiency and, therefore, for
the superiority of index funds came from traditional economics, which
treated each investor as a fully rational party. When behavioral
economics showed that rationality assumption to be a fiction, with
investors subject to a variety of decision-making biases, the claim for
active management should have been vindicated. In a marketplace of blind
participants, one-eyed professionals figured to be king.
The early research supported that notion. To the astonishment of efficient-market theorists--Eugene Fama was so surprised that he had a graduate student double-check the numbers because he doubted their accuracy--Werner De Bondt and Richard Thaler discovered in 1985 that a very simple plan of buying the stocks with the worst 36-month returns and then holding them for the next 36 months had generated outsized gains over the previous six decades. Such results could not be explained by the efficient-market hypothesis. But they could come from irrational investor overreaction, as predicted by the behavioral economists.
The opportunity for professional managers, it seemed, was immense. If the mindless tactic of buying a basket of losers could comfortably beat the S&P 500, then surely a mindful tactic, informed by a brilliant, trained expert, could absolutely thrash the overall market. Reliably. Consistently. Again and again.
We all know how that has played out. As behavioral economics has grown in popularity, becoming a mainstream academic pursuit and earning Daniel Kahneman a Nobel Prize (an award he would have shared with co-author Amos Tversky, had Tversky been alive), the performance of active portfolio managers has declined. Meanwhile, once-tiny Vanguard has become by far the largest fund company on the globe, mostly courtesy of its index funds. The behavioral-economics boost was no boost at all.
...
All that said, I think that behavioral research does suggest a couple of fruitful investment paths.
One is to use mechanical approaches. According to Kahneman, using a simple algorithm often yields better results than relying on the individual judgment of subject-matter experts. He cites as an example the Apgar test for judging a newborn baby’s health--a simple checklist, capable of being used by various medical staff, that replaced a doctor’s personal evaluation. The adoption of the test proved “an important contribution to reducing infant mortality” because the gain in consistency from using an universal system outweighed the loss of losing personal insights.
The obvious candidates are strategic-beta funds, which mechanize active management’s strategies. Value, momentum, low volatility ... if an attribute appears to offer investment merit and is used as a screen or input by active managers, then it can be converted into a rule (or set of rules) that governs a strategic-beta fund. As with the Apgar test, much complexity is shed when moving from the experts to a rules system. But perhaps the benefit of consistency is worth the trade-off--particularly as strategic-beta funds usually have lower expense ratios.
The other opportunity lies in opting out of the game. Let others pummel each other over the gains to be made from short- to intermediate-term decisions. Whether won by the savviest of the active managers or via smart beta, those prizes will be difficult to obtain, with so many people chasing the same trades. Instead, stand and wait. Buy securities that for some reason--liquidity is one possibility, but there are others--are unattractive to those with shorter horizons but that may deliver above-market returns over the long haul.
This, of course, is the approach followed by the world’s most successful investment fund: Berkshire Hathaway (BRK.A). Its disciple, Sequoia Fund (SEQUX), has also fared well, beating just about every single one of its mutual fund peers over the past several decades. Both securities thrive by buying when others are disinterested. Behavioral researchers point out that most people who are making decisions don’t think much about what others are doing, with the result that they unwittingly land in a crowd when they arrive at the same conclusions as the rest of the mob. Berkshire and Sequoia don’t have that problem. They recognize what others have done, and they step the other way.
Wednesday, August 05, 2015
index card investing
Wall Street and its representatives often make investing more
complicated than necessary to give investors the idea that they are
helpless on their own. University of Chicago professor Harold Pollack
has gained acclaim recently for insisting that all the important
financial advice you need can fit on one side of a 4x6 index card. When I
first heard this, I thought, "How small did he print?" A picture
of the index card reveals that Pollack provided nine pieces of advice,
written in rather large print. Let's take a look at the professor's
recommendations to see if they contain all the financial advice you
need.
Here's what I agree with (in principle):
4. Save 20% of your money. [Not necessarily 20%, but at least something]
5. Pay your credit-card balance in full every month.
***
Here's my number 1 rule (and no. 2)
1. Spend less than you make
2. Invest what you don't spend
Here's what I agree with (in principle):
4. Save 20% of your money. [Not necessarily 20%, but at least something]
5. Pay your credit-card balance in full every month.
***
Here's my number 1 rule (and no. 2)
1. Spend less than you make
2. Invest what you don't spend
Wednesday, July 22, 2015
the retail investor has never had it better
Its easy to see if one brokers commission is cheaper than another's.
Before now, however, it was hard to know which brokers were saving you
the most money through good trade execution—for example, by getting you a
stock price that's better than the quote you saw when you pressed the
"Place Order" button. For such "price improvement," discount brokers
squeeze Wall Street market makers to give up some of the bid-ask spread
to benefit the broker's retail customers. New numbers released recently
by the industry indicate that a retail trader can get the best pricing
from Fidelity's discount brokerage unit. This confirms the findings of Barron's computer-aided analysis earlier this year ("The Little Guy Wins!" March 2).
***
In the furor surrounding last year’s best-seller Flash Boys, by Michael Lewis, many retail investors were spooked by the book’s claim that high-frequency traders use their technology edge to pick off the little guys, who, the author claims, were “easy kill” for the professionals. That part of the story was just wrong. While some institutional traders have fallen behind in the computer arms race, the evidence shows that retail traders enjoy some of Wall Street’s best prices on their stock orders. Surprisingly, the little guy’s advantage has grown in the past couple of years.
“The retail trader has never had it better,”
says Robert Battalio, a finance professor at the University of Notre
Dame who wasn’t afraid to criticize stockbrokers at Senate hearings amid
the Flash Boys debate. “When you place a market order today,
you pay a lower commission, you get an immediate confirm, and very
rarely are you getting worse than the price you saw when you pushed the
button,” he says. • The competition for retail traders’ orders actually
yields a price that’s better than the published quote, on average, when
small investors go to buy or sell at the market price. The resulting
savings can be trivial or as large as a discount broker’s commission,
but across the industry, these price improvements were worth almost $600
million to individual investors last year, according to
financial-market analytics firm RegOne Solutions. That’s much less than
the billions paid out in commissions, but it’s hardly chump change. As
irony would have it, these savings mostly result from the
computerization of market makers and retail brokers.
The public has never seen much information on which firms do the best job executing stock trades. So Barron’s
spent months analyzing trade-quality reports of the big “wholesale”
market makers, where discount brokers send most buy orders to find a
matching sell, and vice versa.
By our scoring, Fidelity Brokerage Services finished No. 1, and
Charles Schwab
(SCHW) and
E*Trade Financial
(ETFC) tied for second among discount brokers.
Saturday, July 18, 2015
in defense of active management
This month, Charley Ellis published "In Defense of Active Investing." The headline intrigues because Ellis is an indexing legend. In 1975, he wrote that active investing is "The Loser's Game."
The article became an instant classic and was later incorporated into
the curriculum for Chartered Financial Analysts candidates.
"The Loser's Game" argued that investment success lies not in hitting the most winners, as it's very difficult to strike winners while competing against hordes of other informed investors, but rather in minimizing the "losers" of turnover, costs, and taxes. (All right, taxes are my addition, as 1970s institutional investors never considered the subject, but Ellis would certainly have discussed them had he thought about retail accounts.)
He writes that, although it's difficult to win the Loser's Game, it is also "hard to lose." After all, the corollary of the criticism that active managers mostly hold the market is that active managers mostly hold the market. The biggest success for any prospective investor lies in getting into the game. After that, the leakage caused by active managers is modest. Besides, investing actively is good entertainment. "Since active investing is exciting and fun, investors who are losing a bit in purely economic terms surely enjoy a significant social good by being part of the action."
While I don't believe the case for active management is as hopeless as Ellis presents, as investors can improve their odds by seeking funds that share certain common attributes, I do not dispute his thesis. Active managers do set efficient security prices. They do help global markets to function smoothly. But there's no particular reason why you need to own them.
Ellis' "defense" of active management is in reality a highly effective attack. He came not to praise active managers, but to bury them.
Monday, July 13, 2015
Grexit has gone
Greece reached a desperately-needed bailout deal with the eurozone on
Monday after marathon overnight talks, in a historic agreement to
prevent the country crashing out of the European single currency.
Leftist Prime Minister Alexis Tsipras agreed to tough reforms after 17 hours of gruelling negotiations in return for a three-year bailout worth up to 86 billion euros ($96 billion), Greece's third rescue programme in five years.
"EuroSummit has unanimously reached agreement," EU President Donald Tusk said. "All ready to go for ESM (eurozone bailout fund the European Stability Mechanism) programme for Greece with serious reforms and financial support."
The new rescue for Athens is the country's third since 2010 and came after a bitter six-month struggle following Tsipras's election in January that put Greece's membership of the eurozone in the balance.
Greek banks have been closed for nearly two weeks and there were fears they were about to run dry due to a lack of extra funding by the European Central Bank, meaning Athens would have had to print its own currency and effectively leave the single currency.
"Grexit has gone," European Commission President Jean-Claude Juncker told AFP, ruling out the threat of Greece leaving the single currency, which could potentially destablise not only the euro but the world economy.
Tsipras insisted the deal was good for Greece despite the fact that the harsh terms were near identical to those rejected by Greeks in a referendum just one week ago.
Sunday, July 12, 2015
Mitch Zacks 2015
[7/19/15] There’s a big piece missing from the Chinese ‘stock market mania’
narrative, and it’s probably the most important part of the story –
explaining how China’s equities markets actually work!
The basic premise is that Chinese equities are divided into A-shares and H-shares. A-shares are available for trading almost exclusively by Chinese investors, meaning that the market is missing two critical components of efficiency: maximum liquidity and global participation. It follows that A-shares have virtually no correlation to global markets—one zigs and the other zags, one soars while the other only nudges higher.
It’s the A-shares that are creating all the hubbub in the press. Over the last year (through July 14), A-shares climbed almost +150% through June 12, then fell nearly 35% to their low on July 8. That’s the type of market activity investors are wise to avoid.
Chinese H-shares are a different story, and they matter more for the narrative. H-shares trade on the Hong Kong exchange, which is an open market where international investors can participate. The difference in the market action is astounding: H-shares went up a little over +40% to a peak on May 26, and have fallen about 20% over the last month or so. That’s eyebrow raising volatility, but it’s not an Armageddon-like swing many are now associating with China.
If you look at global stocks over the same period, you’ll notice that they have virtually no resemblance to Chinese equities, A-share or H-share. The MSCI World is essentially flat over the last year.
[7/12/15 Mitch Zacks] If you had just one word to describe the market so far in 2015, it might be: volatile. And, this can be concerning. Regardless, for all the market machinations, performance essentially finished flat eking out a 0.7% (S&P 500) gain. So, what do we think will happen next?
At first glance, the economic backdrop might raise eyebrows: a second estimate of U.S. GDP shows contraction of -0.7% in Q1 and incoming data point to a tepid rebound in Q2, perhaps +2%. Additionally, if you consider uninspiring domestic growth, an escalating Greece situation, the wild China stock ride and imminent U.S. rate hike(s), you might conclude the odds are stacked against a strong finish in 2015.
And, you may be right. But these factors are not enough to turn bearish for these four reasons:
1. Markets Tend to Do Well in Rising Rate Environments
– the last three rate hike cycles have corresponded with strong
market performance. In 1994 – 1995, the Fed raised rates 7 times and the
S&P 500 annualized 18% in that period; in 1999 – 2000, there were 6
hikes and the S&P 500 annualized 5%; from 2004 – 2006, 17 rate
hikes and 16% annualized on the S&P. It makes sense why this occurs:
if the Fed is raising rates, it’s because the economy has underlying
strength! Stocks tend to do well when that’s the case.
3. Greece is a False Fear, Creating a Wall of Worry Markets Love to Climb
– the Greece story is now over two years old, which means the
market has had plenty of time to price-in the worst. Even if there is a
“Grexit,” we think it’s probably only capable of inciting a bit of
short-term volatility. All this talk of the European banking system
collapsing or systemic issues surfacing (if Greece leaves) are
over-reactions in my view. False fears are almost always tailwinds for
stocks.
The Bottom Line for Investors
The basic premise is that Chinese equities are divided into A-shares and H-shares. A-shares are available for trading almost exclusively by Chinese investors, meaning that the market is missing two critical components of efficiency: maximum liquidity and global participation. It follows that A-shares have virtually no correlation to global markets—one zigs and the other zags, one soars while the other only nudges higher.
It’s the A-shares that are creating all the hubbub in the press. Over the last year (through July 14), A-shares climbed almost +150% through June 12, then fell nearly 35% to their low on July 8. That’s the type of market activity investors are wise to avoid.
Chinese H-shares are a different story, and they matter more for the narrative. H-shares trade on the Hong Kong exchange, which is an open market where international investors can participate. The difference in the market action is astounding: H-shares went up a little over +40% to a peak on May 26, and have fallen about 20% over the last month or so. That’s eyebrow raising volatility, but it’s not an Armageddon-like swing many are now associating with China.
If you look at global stocks over the same period, you’ll notice that they have virtually no resemblance to Chinese equities, A-share or H-share. The MSCI World is essentially flat over the last year.
[7/12/15 Mitch Zacks] If you had just one word to describe the market so far in 2015, it might be: volatile. And, this can be concerning. Regardless, for all the market machinations, performance essentially finished flat eking out a 0.7% (S&P 500) gain. So, what do we think will happen next?
At first glance, the economic backdrop might raise eyebrows: a second estimate of U.S. GDP shows contraction of -0.7% in Q1 and incoming data point to a tepid rebound in Q2, perhaps +2%. Additionally, if you consider uninspiring domestic growth, an escalating Greece situation, the wild China stock ride and imminent U.S. rate hike(s), you might conclude the odds are stacked against a strong finish in 2015.
And, you may be right. But these factors are not enough to turn bearish for these four reasons:
2. We Expect GDP Growth to Average 3% Over the Next Four Quarters
– we expect earnings to recover and for the economy to expand at a
moderate, but reasonable, pace. This should push unemployment down to
5.1% by the end of Q4 with core inflation, based on Personal Consumption
Expenditures [PCE], creeping up to 2% by 2017. Not too hot, not too
cold. With multiple expansion that has come with Fed easing the last six
years, we think the market should move more in-line with earnings
growth versus seeing P/Es climb much further. That could mean single
digit S&P 500 growth in the next year or two.
4. Global Growth Should Continue Apace
– in spite of Europe’s Greece dealings, the region should see
growth in the range of 1% - 2% this year, which is more than it has
grown in a few years. Having Europe back in the plus-column is good for
global GDP, and I think the U.S. and China will hold up in spite of the
jitters that appear to be surfacing. China is willing to ease and the
U.S. should recover in the back half like we did in 2014.
With the Fed tightening, modest corporate earnings growth, and a further
decline in the equity risk premium, we expect the S&P 500 to notch
up +4% to finish the year. While 4% isn’t the kind of return we’ve
become accustomed to as of late, it still beats what you can get from
U.S. Treasuries, or much of what can be attained in fixed income
markets. And, the outlook for equities beyond 2015 remains positive with
the possibility of upside surprises in my view. For the long-term
growth investor, equities likely remain the best asset class for now.
Thursday, July 09, 2015
The Five Richest Superheroes
It’s pretty good to be a superhero. As if it weren’t enough to have the
awesome fighting powers themselves, the men and women who grace our
comic book covers and headline blockbuster action movies also get spiffy
outfits, cool names, dashing good looks, and, in many cases, a huge
fortune to help fund their crime-fighting adventures. As Comic-Con kicks
off in San Diego, we at Money decided to research how much the
wealthiest caped crusaders are worth and see which champion is the most (economically) powerful.
[Surprise spoiler: the richest is not Bruce Wayne or Tony Stark. And it's not even close...]
[Surprise spoiler: the richest is not Bruce Wayne or Tony Stark. And it's not even close...]
Wednesday, July 08, 2015
China's crash continues
China’s stock rout spread to the country’s commodities markets as investors rushed to raise cash.
Everything from silver to sugar to eggs tumbled with the Shanghai Composite Index, which crashed to a three-month low on Wednesday. Government measures to stabilize equities are failing to stop a stock market collapse.
“People are selling everything in sight to get their hands on cash,” Liu Xu, a trader at private asset-management company Guoyun Investment Co. in Beijing, said by phone. “Some need to cover their margin calls in the stock market, while others are gripped by fear that the Chinese economy will be affected by this crisis.”
Metals including nickel and silver on the Shanghai Futures Exchange
fell to their daily limits, while rubber entered a bear market. The
volume of copper traded was almost six times the three-month average.
Steel rebar and iron ore, as well as eggs, sugar and soybean meal
dropped to the lowest level allowed by their exchanges.
“Agricultural products in my view are collateral damage in this selloff,” said Liang Ruian, a fund manager at Shanghai-based Jianfeng Asset Management Co. “Pigs are still going to eat, so what does this stock market stampede have to do with soybean meal?”
***
SHANGHAI — Stock prices in mainland China fell sharply again on Wednesday, continuing a decline that began last month despite another series of government measures meant to restore confidence and stabilize a market that has grown increasingly turbulent.
Just days after Beijing introduced a number of bold measures to prop up share prices, including a pledge by some of the country’s largest brokerage houses to create a $19.4 billion stabilization fund, regulators announced new initiatives early Wednesday, including an easing of rules to allow insurers to invest more money in stocks and the creation of a fund to buy up shares in small and midsize companies.
Still, China’s biggest exchanges were battered. The main Shanghai index plunged 5.9 percent Wednesday, and the Shenzhen index fell 2.5 percent. The Shanghai index is down 32 percent and the Shenzhen is off 40 percent from the highs reached in mid-June.
In Hong Kong, which had escaped much of the mainland market’s rout, the Hang Seng index fell 5.8 percent.
The sell-off has also spread to other parts of the Asia-Pacific region. In Japan, the Nikkei 225-stock average dropped 3.1 percent, Australian stocks were down 2 percent and South Korean shares fell 1.2 percent.
Fear is gripping the markets after a phenomenal bull run in which mainland China’s major stock indexes doubled, tripled and even quintupled over the last few years. Sentiment has turned down too sharply and investors have lost confidence, analysts said, and because buying shares with borrowed money was a critical part of the increase in prices, there is now pressure to sell.
“China’s stock market remains under stress, as investor confidence will take some time to recover,” Li Wei, the China economist at the Commonwealth Bank of Australia, wrote in a report to investors.
Panic selling may also be extending the downturn because each day trading is suspended for hundreds of stocks after they drop by 10 percent, under exchange rules. Some companies are even asking that their shares be temporarily suspended, hoping to ride out the downturn.
Since late June, on almost every trading day, there have been more than 900 stock trading suspensions, according to Xinhua, China’s official news agency. On Tuesday and Wednesday, 900 to 1,700 stocks were suspended from trading. That means that among the approximately 3,000 listed companies on the two major exchanges, up to half may have been suspended during the first two days of the week.
“This is wrong,” said Francis Cheung, the head of China and Hong Kong strategy at CLSA, the brokerage firm. “It just delays the correction. So it delays the downturn.”
The Chinese authorities have been moving swiftly, apparently worried about the potential impact the sell-off could have on the financial markets and on a broader economy that is relatively weak. Although experts say they doubt there could be systemic damage, banks and brokerage firms could be threatened because of the huge amount of margin trading, or borrowing to purchase stocks.
By some estimates, margin trading may have amounted to as much as 3.4 trillion renminbi, or nearly $550 billion. And because some of the borrowing probably took place in the shadow banking sector, no one is quite clear how big it was.
The bubble seems to be bursting on a stock market run that began last summer. In a rally that began roughly a year before the market’s high point on June 12, the Shanghai index jumped 157 percent. The Shenzhen index rose even more during that period, rising about 208 percent. A smaller stock market in Shenzhen called the ChiNext, geared toward technology companies and start-ups, began its own bull run much earlier, in late 2012, and soared about 540 percent before the markets began to falter several weeks ago.
Based on company earnings, the prices of many Chinese stocks began looking incredibly expensive, trading at far higher prices than could be found in Hong Kong or the United States, worrying analysts and investors.
“It’s gone up too fast, and it’s too much borrowed money,” said Wendy Liu, an analyst at Nomura Securities in Hong Kong. “A lot of first-time equity buyers were too excited and didn’t know how to temper their excitement.”
Even after the big sell-offs, though, stock prices in China are still considerably higher than they were a year ago. The Shanghai composite is still up 74 percent from mid-2014, and the Shenzhen composite is up 84 percent since then.
Everything from silver to sugar to eggs tumbled with the Shanghai Composite Index, which crashed to a three-month low on Wednesday. Government measures to stabilize equities are failing to stop a stock market collapse.
“People are selling everything in sight to get their hands on cash,” Liu Xu, a trader at private asset-management company Guoyun Investment Co. in Beijing, said by phone. “Some need to cover their margin calls in the stock market, while others are gripped by fear that the Chinese economy will be affected by this crisis.”
“Agricultural products in my view are collateral damage in this selloff,” said Liang Ruian, a fund manager at Shanghai-based Jianfeng Asset Management Co. “Pigs are still going to eat, so what does this stock market stampede have to do with soybean meal?”
***
SHANGHAI — Stock prices in mainland China fell sharply again on Wednesday, continuing a decline that began last month despite another series of government measures meant to restore confidence and stabilize a market that has grown increasingly turbulent.
Just days after Beijing introduced a number of bold measures to prop up share prices, including a pledge by some of the country’s largest brokerage houses to create a $19.4 billion stabilization fund, regulators announced new initiatives early Wednesday, including an easing of rules to allow insurers to invest more money in stocks and the creation of a fund to buy up shares in small and midsize companies.
Still, China’s biggest exchanges were battered. The main Shanghai index plunged 5.9 percent Wednesday, and the Shenzhen index fell 2.5 percent. The Shanghai index is down 32 percent and the Shenzhen is off 40 percent from the highs reached in mid-June.
In Hong Kong, which had escaped much of the mainland market’s rout, the Hang Seng index fell 5.8 percent.
The sell-off has also spread to other parts of the Asia-Pacific region. In Japan, the Nikkei 225-stock average dropped 3.1 percent, Australian stocks were down 2 percent and South Korean shares fell 1.2 percent.
Fear is gripping the markets after a phenomenal bull run in which mainland China’s major stock indexes doubled, tripled and even quintupled over the last few years. Sentiment has turned down too sharply and investors have lost confidence, analysts said, and because buying shares with borrowed money was a critical part of the increase in prices, there is now pressure to sell.
“China’s stock market remains under stress, as investor confidence will take some time to recover,” Li Wei, the China economist at the Commonwealth Bank of Australia, wrote in a report to investors.
Panic selling may also be extending the downturn because each day trading is suspended for hundreds of stocks after they drop by 10 percent, under exchange rules. Some companies are even asking that their shares be temporarily suspended, hoping to ride out the downturn.
Since late June, on almost every trading day, there have been more than 900 stock trading suspensions, according to Xinhua, China’s official news agency. On Tuesday and Wednesday, 900 to 1,700 stocks were suspended from trading. That means that among the approximately 3,000 listed companies on the two major exchanges, up to half may have been suspended during the first two days of the week.
“This is wrong,” said Francis Cheung, the head of China and Hong Kong strategy at CLSA, the brokerage firm. “It just delays the correction. So it delays the downturn.”
The Chinese authorities have been moving swiftly, apparently worried about the potential impact the sell-off could have on the financial markets and on a broader economy that is relatively weak. Although experts say they doubt there could be systemic damage, banks and brokerage firms could be threatened because of the huge amount of margin trading, or borrowing to purchase stocks.
By some estimates, margin trading may have amounted to as much as 3.4 trillion renminbi, or nearly $550 billion. And because some of the borrowing probably took place in the shadow banking sector, no one is quite clear how big it was.
The bubble seems to be bursting on a stock market run that began last summer. In a rally that began roughly a year before the market’s high point on June 12, the Shanghai index jumped 157 percent. The Shenzhen index rose even more during that period, rising about 208 percent. A smaller stock market in Shenzhen called the ChiNext, geared toward technology companies and start-ups, began its own bull run much earlier, in late 2012, and soared about 540 percent before the markets began to falter several weeks ago.
Based on company earnings, the prices of many Chinese stocks began looking incredibly expensive, trading at far higher prices than could be found in Hong Kong or the United States, worrying analysts and investors.
“It’s gone up too fast, and it’s too much borrowed money,” said Wendy Liu, an analyst at Nomura Securities in Hong Kong. “A lot of first-time equity buyers were too excited and didn’t know how to temper their excitement.”
Even after the big sell-offs, though, stock prices in China are still considerably higher than they were a year ago. The Shanghai composite is still up 74 percent from mid-2014, and the Shenzhen composite is up 84 percent since then.
Friday, July 03, 2015
the single biggest risk
Investors who do the least will likely do the best over time. For
the huge majority of people, investing a set amount of money each month
consistently over a long period of time will outperform any trading
strategy they attempt. The evidence on this is overwhelming.
It's so overwhelming that I think the single biggest risk you face as
an investor is that you'll try to be a trader. It's the financial
equivalent of drunk driving -- recklessness blinded by false confidence.
"Benign neglect, bordering on sloth, remains the hallmark of our
investment process," Warren Buffett once said. It probably should be
yours, too.

Thursday, July 02, 2015
The Penny Hoarder
Somehow I have started seeing these Penny Hoarder stories on facebook. Maybe they're paying to be seen. Or maybe some of my friends like them. Anyway, they have some handy stories which appeal to penny-pinchers (like me).
So I created this post to list some of their articles.
[7/2/15] 10 Ways You Waste Money
9. Paying for Extended Warranties
Almost a third of consumers buy extended warranties each year, according to a study reported on CardHub.com. These policies provide manufacturers with 50 to 60% profit margins, because appliances and electronics just don’t break down that often.
In other words, don’t buy this expensive insurance. Yes, your printer could break just after the regular warranty expires, and you’ll have to pay cash to replace it. If this happens, just remember all the money you saved by not buying extended warranties on the other items — the ones that didn’t break down.
[This one I noticed on 5/6/15] 32 Ways to Make Money at Home
questions to ask your financial advisor (or yourself)
If I was going to trust someone to manage my life savings for the years
and decades to come, I would make sure that all of these questions were
answered beforehand:
(1) What is your investment strategy?
This should set your expectations if you ultimately decide to invest with this person; it also gives you a way to confirm that they’re sticking to the strategy. I would want a rough idea of how much turnover the manager expects in the portfolio, the number of holdings, any cap on position size, etc; the advisor should be able to clearly explain what it is that they will do for you. If you don’t understand what they’re talking about, ask questions and make sure that it is clear before you walk out of the door; if you’re still confused when you leave, I’d personally look elsewhere. You might find it odd that people wouldn't ask this; you would think it would be the first item addressed. In my experience, the issue is that this rarely goes deeper than a few sentences from the advisor hitting the high points, with no follow up from the client; there really should be more.
(2) What are your thoughts on active investing versus passive investing?
The person you’re talking with should be able to put this in terms you can understand (read around online before you visit with them if you’re unfamiliar with the debate or else asking won’t do you any good). If they plan on taking a passive approach, I have no problem with that: I still see a need for some clients to do this through an advisor (primarily for having someone to talk to). However, the fees in that scenario should be quite low; I think that anything above 50 basis points or so (0.50%) would be excessive - and even that might be a bit steep. If they make the argument for an active strategy, that’s fine as well; at that point, I’d ask the following:
What makes you think that you can outperform the major indices like the S&P 500 over time? What is your competitive advantage as an investor long term?
People all over the country and the world wake up every day hoping to make money in the stock market. Many are essentially gambling, while others have a near infinite set of resources at their disposal (or even insider information). I think that if you plan on being successful long term you must have something that distinguishes you from the herd; being different on its own obviously doesn’t guarantee success, but it is a requirement for performance that differs from the index (hopefully to the upside). I would simply want to know why they believes they can do better than the market over time. Hopefully this was touched on when you asked about their strategy.
(3) How do you make money from my account?
I’m a big believer in the power of incentives; I would want to be assured that my advisor’s interests are aligned with mine at all times. If someone is being paid to sell you a certain product or fund, you better take a hard look at whatever it is that they’re selling you. My personal opinion is that you would be better off taking your business elsewhere.
I want the fees generated from my account to be correlated with changes in the account value; that would call for either a fee based on the assets managed or a fee based on annual returns (like Warren Buffett’s arrangement when he ran his partnerships); I can’t think of any other way of paying my advisor / manager that I would be comfortable with.
(4) What type of returns can I realistically expect long term?
As with the first question, it’s important to ensure that you’re on the same page with the person who will be managing your money. If you’re only comfortable with limited volatility and they tell you 15% a year is attainable, there’s a misunderstanding that needs to be addressed. Just for clarification, I wouldn’t expect (or necessarily want) a specific number – a range is fine.
(5) How long have you been investing personally, as well as for other people? What have your returns been over the past ten-plus years, or since you started managing money?
This question is quite direct; suffice it to say that it’s worth dealing with a bit of discomfort to ensure that the person you’re about to entrust with your retirement money knows what they’re doing. While the returns are obviously front and center with this question, it also gives you a clear opportunity to consider another potential issue: closet indexing. If the long term returns for the manager are nearly identical to the index, it is worth considering whether or not you really should be paying this individual for “advice” that could easily be replicated for a few basis points on your own with Vanguard. I wouldn’t have thought this is nearly as common as it actually is (or has been in my experience reviewing prospective clients account statements).
(6) What benchmark do you judge your results against? Why?
Most people use the S&P 500, but some use other indices (for example, Wedgewood Fund uses the Russell 1000); simply ask for an explanation and make sure the response is logical if it’s anything besides the S&P 500. It’s worth remembering that if they show you their returns and the index is blended (some mix of stocks and bonds), take that into consideration if you’re looking at their returns from a stock only (or more heavily weighted) model / portfolio.
(7) Can you tell me about one of your worst investments in the past few years? What did you learn from the experience?
This sounds like something you might hear at a job interview, but I think it’s important (and fair game): I want someone who is willing to admit that they’ve made bad investments in the past, and more importantly, has learned from those mistakes.
(8) How much of your own money is invested in the same securities that you plan on purchasing for my account?
Again, this seems direct, or even impolite. My opinion, as someone who sits on the other side of the table from clients, is that this is fair game; in fact, I would be happy to be asked this (which gives you a good idea of what my answer would be).
Any advisor / money manager that’s offended by this or the other questions mentioned above should be avoided in my opinion. As for the answer, I think that at least half of the invested assets for the decision maker at the firm (hopefully the person you’re talking to) should be the same as what they put their clients in, and hopefully even more than that (for comparable asset classes – equities to equities). Maybe I’ve been spoiled by Warren and Charlie, but I think 90% or more sounds like a reasonable number. The person you’re giving money to should be personally investing in the same stocks that they’re buying for you – and in a big way.
Conclusion
This isn’t meant to be a complete list; I’ve focused on the issues that are often overlooked (in my experience) that prospective clients should be asking. I’ll reiterate what I said above: if the person you’re meeting with is offended or put off by your questions, look elsewhere.
The person managing your life savings must be someone that you can trust and ask difficult questions to. Hopefully these questions will help you find the person that’s right for you.
Monday, June 29, 2015
the secret buy sign?
http://video.cnbc.com/gallery/?video=3000392322
It's the investment equivalent of Pavlov's dog. Each time the S&P 500 has touched its 200-day moving average, a sharp rally has soon followed.
And with the recent selloff, the S&P 500 is hovering just above that key technical level, and that has one top technician banging the table on stocks.
"Take advantage of the fear that's out there right now," said Rich Ross, a technician at Evercore ISI, on Monday's "Fast Money."
Ross noted that since 2011, the market has touched its 200-day moving average three times and each time the market has waged a significant rally. The first time was in 2012 which led to a 15-percent rally in stocks in the following three months and again toward the end of that year, which sparked a nearly 50-percent rally in stocks over the next 10 months. The third time was in October of last year, which has led stocks to another 14 percent in gains since then.
"There is absolutely no subjectivity in moving averages like the 200-day moving average; in contrast to trend lines and horizontal lines of support and resistance, the 200-day moving average is the same for everyone."
"Three big rallies after the dip below [the 200-day moving average], and I think you're going to see history repeat itself," said Ross.
narrow years and shocks to the system
The first half of this year for the S&P 500 was the narrowest in
history. In other words, the market’s range from peak-to-trough on a
closing basis this year has been a record low, as seen in the table
below, courtesy of Bespoke Investment Group (BIG).

If history is a guide, the rest of the year could break to the upside…eventually. In fact, in the prior top-10 narrowest starts to the year, the remainder of the year always had a positive return.
Shocks and stocks
This analysis is in keeping with the history of the stock market around “shocks to the system.” The data highlighted below should serve to remind investors that although sensational headlines typically garner the most article views and/or reader clicks, market history shows that “crises” often have very quick and limited impact on markets.

[Down only 10.8% for Pearl Harbor and 11.6% for 9-11.]
As you can see, of the 14 crises/shocks in the table above, the average market decline was less than 6% and losses were recovered in about two weeks. S&P did note in the report that accompanied the table that several of the losses were much greater than the average, with longer recoveries. However, those “extreme situations usually occurred with the confines of a long-term bear market and did not precipitate the initial decline. Examples of these include: 1) Pearl Harbor, 2) President Nixon’s resignation, 3) the terrorist attacks on 9/11, and 4) the collapse of Lehman Brothers.”
Saturday, June 27, 2015
active/passive barometer
Few investment topics are as hotly debated as the merits of active and
passive investing. The debate will continue to ebb and flow with the
regular cycles of active managers' collective out- or underperformance
relative to their benchmarks and a fast-growing and rapidly evolving
field of passive alternatives. In order to ground this debate with data
that reflects investors' shared experience, Morningstar is starting to
publish an Active/Passive Barometer. This is a semiannual report that
measures the performance of U.S. active managers against their passive
peers within their respective Morningstar Categories.
The Active/Passive Barometer finds that actively managed funds have generally underperformed their passive counterparts, especially over longer time horizons, and experienced higher mortality rates (that is, many are merged or closed). In addition, the report finds that failure tends to be positively correlated with fees.
The Active/Passive Barometer finds that actively managed funds have generally underperformed their passive counterparts, especially over longer time horizons, and experienced higher mortality rates (that is, many are merged or closed). In addition, the report finds that failure tends to be positively correlated with fees.
Saturday, June 20, 2015
the flexibility of options
Most people know that options afford the investor many advantages, not the least of which is a guaranteed limited risk when buying calls and puts.
And you can also get a great deal of leverage while using only a fraction of the money you would normally have to put up to get into the actual stocks themselves.
But those are just some of the advantages of options.
The real advantage with options is the opportunity to make money if a stock goes up, down, and depending on your strategy, even sideways.
This flexibility gives the options investor the opportunity to profit in virtually any market condition - even when you're unsure what the market will do.
Even though the popularity of options has soared, they are still not as well known or understood as much as stocks.
But it's all a lot easier than you might think.
1) Are You Bullish?
If you believe the price of a stock will go up, you can buy a call option on it and make money as it goes higher.
The option buyer gets a guaranteed limited risk, which is limited to the purchase price (or premium) plus any applicable commissions and fees.
Essentially, at expiration, your profit is the difference between where the stock price is and your option's strike price, less what you paid.
Example:
Let's say a stock was trading at $50.
You buy a $45 call option with a premium of $6.50, i.e., $650.
At expiration, the stock has shot up to $65.
Your $45 call would now be $20 in-the-money making it worth $2,000.
So the option is worth $2,000.
You paid $650.
That's a gain of $1,350.
All on just a $650 investment.
Worst case scenario: if the stock at expiration closed below your option’s strike price of $45, you could lose the entire $650. But even if the price went down to $0, you could never lose any more than that. Whereas with a stock, you'd be on the hook for it all.
2) Are You Bearish?
If you believe the price of a stock will go down, you can buy a put option on it and make money as the price goes lower.
Once again, the option buyer gets a guaranteed limited risk, which is limited to the purchase price (or premium) plus any applicable commissions and fees.
At expiration, your profit is the difference between where the stock price is and your option's strike price, less what you paid.
Example:
Let's say a stock was trading at $60.
You buy a $65 put option with a premium of $7.00, i.e., $700.
At expiration, the stock has dropped to $40.
Your $65 put would now be $25 in-the-money making it worth $2,500.
So the option is worth $2,500.
You paid $700.
That's a gain of $1,800.
All on just a $700 investment.
Worst case scenario: if the stock at expiration closed above your strike price of $65, you could lose what you paid for the option. But even if the stock went against you even more, you could never lose any more than that.
3) Expecting a Big Move, But Not Sure Which Way?
A straddle is a way to make money when you're not sure which way the market will go, but you believe something big will happen in either direction.
With a straddle, you're buying both a call and a put at the same time, with the same strike price, and the same expiration date.
For example, let's say its earnings season and you expect a big move to occur, either up or down, based on whether the company reports a positive surprise or a negative surprise. Or maybe the charts are suggesting a big breakout could be getting ready to take place in one direction or another.
With this strategy you can make money in either direction without having to worry about whether you guessed correctly or not.
Example:
Let's say a stock was trading at $100 a few days before their earnings announcement.
You buy the front month $100 strike call for $150.
And you buy the front month $100 strike put also for $150.
That's a cost of $300 (not including transactions costs) to put on the trade.
Now let's say the stock shoots up $15 as a result of a positive earnings surprise.
The call option is now worth $1,500
The put option is worth $0.
You paid $300.
That's a profit of $1,200.
All on just a $300 investment.
The best part with this strategy is if the stock had posted a negative surprise and it dropped -$15 instead, you would have been just as profitable. The only difference is that the put would have been the profitable side and the call would have been the loser. (But so what, because you didn't care which way it went, you just expected something big to happen in one direction or the other.)
Worst case scenario: at expiration, if nothing big ever happens, you would have lost the entire $300.
4) Expecting a Stock to Fall (or at Least Not Go Much Higher)?
Writing calls can be profitable in mildly bullish markets, sideways markets and bearish markets.
Buying a call option gives you the right but not the obligation to purchase 100 shares of a stock at a certain price within a certain period of time. The price you pay for the option, let's say $500 for example, is called the premium.
If you write an option, you're collecting that premium. Someone else is buying the right to own 100 shares of a stock at a certain price within a certain period of time. And that premium is paid to you.
If that stock goes down and the option expires worthless, the buyer of the option loses -$500, but the writer of the option makes $500.
Example:
Let's say a stock was at $70.
For whatever reason, you determined the stock would go down or at least not go much higher.
Let's also say that you wrote an $80 call for a premium of $5.00 or $500. That means your account would be credited $500.
If at expiration, the stock is at or below the strike price of $80, you'd keep the entire premium of $500.
Even though the stock didn't go down like you thought, but instead went even higher -- $10 higher in this example -- as long as it stayed below your strike price of $80 by expiration, you'd still profit by the full $500 you collected.
Thought the stock was going down.
Instead it went up.
Still made money: $500.
Pretty exciting.
In fact, at expiration, the stock could literally be above the strike price of $80, plus an amount commensurate with what the writer collected for the premium and still not lose any money. (In this case, the stock could literally be at $85 at expiration and you still wouldn't have lost anything.)
Worst case scenario: if the stock went up past the strike price plus the amount collected in premium, then you'd start losing on the trade. And for every $1 above that level, you'd lose $100.
But if the stock looks like it's breaking out above your price level, you can simply buy that option back to limit your loss, or depending on where you are in the trade, lock in a partial gain.
5) Think a Stock Will Go Up, But You'd Like To Buy It at a Lower Price, Yet Still Make Money Even If You Never Get In?
Writing put options is a great way to make money if the market goes up, sideways and even down (to a limited extent).
This is also a way to potentially get into a stock that you'd like to own at a much cheaper price, and get paid while you wait, even if you never get the stock.
As you know, if you buy a put option, you're buying the right to sell a stock at a certain price within a certain period of time. The buyer pays a premium for this right. He has a limited risk - which is limited to the price he paid for the option.
However, the writer is taking the other side. He has to buy the stock if it's put to him at a certain price within a certain period of time. And for this 'risk', the writer collects a premium.
Example:
Let's say a stock was at $50.
And you decided to write a $40 put option, collecting a premium of $4.00 or $400. (Not to mention, looking forward to potentially getting a chance to own that stock a full $10 cheaper than where it's trading at.)
If at expiration, the stock is trading anywhere above your strike price of $40 or higher, you'd keep the entire premium of $400. You may not have gotten that stock, but you still got paid for your wait.
Thought the stock would go up.
But didn't want to buy it at that price.
Wanted it to go down to buy at a lower price.
Never does.
You still made $400.
If at expiration, the stock price is at $40, the buyer of the option could exercise it and you'd now be obligated to buy that stock for $40 a share, which means you've now got that stock at the price you wanted - plus your $400 premium.
Didn't want the stock at $50.
Wished it would go down so you could get it at $40.
Finally does and you get your stock.
Plus $400.
But even if the stock fell to $36 (i.e., down to your strike price plus an amount commensurate with the premium collected -- this would be your breakeven point), you still wouldn't lose anything.
Worst case scenario: the stock would have to fall below $36 to even begin to lose on the trade. And for every $1 below that level, you'd lose $100 due to the stock you now own.
Of course, if you changed your mind, or if you thought the stock could fall below your strike price and even your breakeven point, you could buy the option back at any time, thus cutting your loss or locking in your gain and ending the trade right there without having to even bother with the stock.
Options give the investor numerous ways to make money in the market. Up, down or sideways, decide to make success your only option.
-- Kevin Matras, Zacks Weekend Wisdom
Thursday, June 18, 2015
too much information
Some recent articles by our favorite writers – Grahamites and Science of Hitting – got us thinking about an issue we write about every three or four years – emotions and data in investing. It seems about the time of every market top (or at least 6 of the last 3….), we write an article on the ability to face down your own fears and make money the only way great investors do – purchasing stocks at a substantial discount to fair value. It seems so easy. Wait for a really significant correction, step in, and purchase some great stocks. The rest is investment history. Or at least that's what they say.
Reality has a way of getting in the way of such elucidated thinking. The bottom line is that the vast majority of investors take in far too much information, overreact far too vividly to too much data, blame others for their poor results, and begin the cycle all over again. For the first instance, in a classic study[1] by Richard Thaler, subjects managed an imaginary college endowment consisting of two mutual funds. They could choose how often they received information about fund performance and how often they could trade. The experiment simulated 25 years of investing. The results were clear - participants who received information once every five years, and could trade only that often, earned returns that were more than twice those of participants who were updated monthly and could trade that frequently. The bottom line was that the frequency and amount of data availability directly correlated to poorer returns.
Not only do investors who receive too much data trade more frequently and obtain worse returns, their emotions generally proceed in a rather standard format, rising from a state of panic to euphoria. You can imagine where the latter leaves us in the market cycle.
Conclusions
We live in an age where information is available 24/7. Most of this information provides absolutely no function in evaluating value of our specific holdings. More importantly, the information is provided in a format as to play on our emotions. Finally, we live with a human brain that looks in every possible way to blame others for our failures yet make us feel like genius for our successes. These three factors play an inordinate role in the truly horrific losses occurred every so often when we face significant market corrections. By limiting our data intake, creating models with our own intellect focused on value, and building systems to minimize emotional responses, we can prevent such losses.
what would Peter Lynch say today?
What would Peter Lynch say about investor sentiment today? Peter described the cycle of a bull market through his experience at cocktail parties. Near the bottom of the market, people at these parties had no interest in talking stocks. They were more interested in hearing what’s going on with the dentist. Halfway through a bull market, everyone at the party wanted to find out what stocks Mr. Lynch was buying. At the end of a bull market, the guest liked to tell Peter Lynch (one of the greatest stock pickers of all time) what stocks they were buying and why.
To gauge where we are in the Peter Lynch bull market continuum, let's take a look at this week's sentiment poll from the American Association of Individual Investors at their website, AAII.com. This is a group of individual investors who pay an annual membership fee and participate in a wide variety of online and in-person events to improve their stock picking and asset allocation prowess. In other words, these are folks that are naturally inclined to the stock market. Here is their latest poll:

As a 35-year student of the U.S. stock market, I am astounded at these figures. These are comparable sentiment numbers to the bottom of the bear market in 2002-03! This was after tech stocks got crushed in the three preceding years and the index had decline more than 40% from peak to trough. When we access the stock market within the context of these numbers and Peter Lynch's continuum, we find it funny that hardly anyone ever asks us what stocks we bought lately.
Putting all of this together, we like where we are.
Lastly, we love what we heard Peter Lynch say in late 2008 on CNBC with the stock market as miserable as it ever gets. They asked him where he thought the stock market was going to go next. He said, "I'm the wrong guy to ask, I'm always bullish."
Monday, June 15, 2015
Long-Term Winners
Imagine if you had invested in Apple in
the ’80s or Google a decade ago. Many
investors dream of getting in early
on the next big thing, an innovative
company that changes the world and
enriches them.
But a T. Rowe Price study shows that finding these companies is extremely difficult and holding them through rough markets can be even harder. They often are operating not in such dynamic industries as social media and technology but are engaged in such mundane undertakings as bread making.
To identify companies that achieved a 20% or more annualized return over 10 years—a sixfold total gain—the study examined all companies in the Russell 3000 Index with $1 billion to $3 billion in market capitalization over rolling 10-year periods, from 1996 through 2013.
In the 11 different 10-year periods, an average of only 18 companies achieved such stellar performance per period. When not double counting companies that hit the mark in more than one 10-year span, the average dropped to 10.
“The ability to grow revenue at a double-digit pace is really, really hard to do over an extended period of time, and to be able to compound wealth at 20% or more is very rare,” says Henry Ellenbogen, manager of the small-cap New Horizons Fund.
While discovering such potential overachievers may be rare, sticking with them through rough patches can be even more challenging. To reap the outsized rewards these stocks eventually provided, investors had to endure an average decline of 27.1% at some point during that decade.
“It shows you that even during a period when a stock is compounding between six- and eightfold, its price could drop significantly along the way,” Mr. Ellenbogen says. “So you have to be patient and know that you are going to go through a rocky period where the company may be in transition in which it has to reload for the next phase of growth.”
The study also demonstrates that such success is not concentrated in such high-growth sectors as information technology and biotechnology. In fact, the leading sectors for outstanding performance included consumer staples, energy, and industrials.
Flowers Foods, for example, makes bread, snack cakes, and other household staples but was one of the few companies to star in multiple 10-year periods. “Here’s a company whose end market— bread—has had modest growth at best,” Mr. Ellenbogen says. “But it’s a company with good systems and people, runs itself very efficiently, allocates capital well, makes smart acquisitions, and has organically gained market share.”
Success Keys
Not surprisingly, the companies that achieved exceptional performance over 10-year periods exhibited superior financial characteristics. On average, these leaders had median annual sales growth of 19.5%, median annual earnings growth of 17.1%, and average annual return on invested capital of 18.4%—all significantly higher than the average firm in the study.
Value, Too
Exceptional performance does not just come from high-growth companies. Value investors seek the same outcomes but from a different starting place.
“We’re trying to find companies that may offer the same kind of compelling growth prospects but they’re not necessarily fully valued and are actually cheap,” Mr. Wagner says. “These are companies that for whatever reason may have fallen on hard times and their returns may actually be decreasing, but with the strategic moves that could actually make them look like a growth stock down the road.”
“There generally are three ways small companies might achieve outperformance,” Mr. Athey says. “The first is that it is truly a growth company and consistently puts up high-growth numbers. The second is a company that may be near bankruptcy or is really deep value and it comes back from the dead. “The third is a little of both—a company that may be under the radar screen, perhaps with a checkered history, and it’s really cheap, but not because it’s a horrible company. It’s just been neglected and hasn’t performed very well, but maybe new management comes in and the company starts doing better.”
Whether a growth or value investor, Mr. Wagner says, the study’s lessons are the same: “Think long term, be patient, and recognize that even the best companies on the planet will have periods when things don’t look so good.
“Also, when you find something really good that’s working well for you, you should appreciate that’s a rare thing. You have to recognize that you are going to look at a lot of companies before you find one that could be a really big compounder of returns.”
-- T. Rowe Price Report, Summer 2014
Saturday, June 13, 2015
The Buffett-Munger personality
Success in investing doesn't correlate with I.Q. once you're above the level of 25. Once you have ordinary intelligence, what you need is the temperament to control the urges that get other people into trouble in investing. - Warren Buffett
No doubt most of us are familiar with the above quote from Mr. Buffett. Probably most of us, as value investors, also think that we possess the temperament to control the urges. However, does our perception reflect the reality? How can we tell if we have the right temperament or not for investing? How do we define the right temperament?
Things can get complicated once we start asking ourselves these questions. Luckily, following Munger’s idea of simplicity, I think we can greatly simplify the problem by observing who has the right temperament and figure out their personality type through a well-known system. We can then figure out our own personality type and compare ours with those of say Buffett and Munger.
The aforementioned well-known system is called the Myers-Briggs Type Indicator (MBTI) assessment. According to Wikipedia, it is a “psychometric questionnaire designed to measure psychological preferences in how people perceive the world and make decisions.”
Essentially there are four dichotomies of psychological differences with a resulting of 16 possible psychological types. The four dichotomies are
Each term used for each dichotomy has specific technical meanings and each combination of 4 (i.e. each type) has its own distinctive set of characteristics. For instance, “sensing and intuition are the information gathering (perceiving) functions. They describe how information is understood and interpreted. Individuals who prefer sensing are more likely to trust information that is in the present, tangible, and concrete and they tend to distrust hunches. On the other hand, those who prefer intuition tend to trust information that is more abstract or theoretical, that can be associated with other information. They may be more interested in future possibilities.”
Assuming the MBIT system is a good enough one for the discussion of temperament, let’s see if we know what type of person Buffett and Munger are. A little bit of google search combined with our observation and experience show that Buffett is most likely an ISTJ type while Munger is more likely an INTJ type.
Below are the descriptions of these two types from truity.com:
ISTJs are responsible organizers, driven to create and enforce order within systems and institutions. They are neat and orderly, inside and out, and tend to have a procedure for everything they do. Reliable and dutiful, ISTJs want to uphold tradition and follow regulations.
ISTJs have a serious, conservative air about them. They want to know and follow the rules of the game, and typically seek out predictable surroundings where they understand their role. You may find the ISTJ doing something useful even in social situations (for instance, organizing coats and hats at a party) as they’re often more comfortable taking charge of a task than they are chatting up strangers. When given something to do, they are highly dependable, and follow it through to the end.
INTJs are analytical problem-solvers, eager to improve systems and processes with their innovative ideas. They have a talent for seeing possibilities for improvement, whether at work, at home, or in themselves.
Often intellectual, INTJs enjoy logical reasoning and complex problem-solving. They approach life by analyzing the theory behind what they see, and are typically focused inward, on their own thoughtful study of the world around them. INTJs are drawn to logical systems and are much less comfortable with the unpredictable nature of other people and their emotions. They are typically independent and selective about their relationships, preferring to associate with people who they find intellectually stimulating.
The description may not fit perfectly with Buffett and Munger but I think we can all agree that they are fairly close. Munger and Buffett both share ITJ, which are introversion, thinking and judging. Just for a fun trivia, Bill Gates is also an INTJ type.
A good amount of readers on this forum should be this IxxJ pattern. It’s the F or T that should make the alarm sound for those of us who have more “F” than “T” in our types.
Again, the point of this exercise is not to say which personality type is better or worse. My educated guess is that if you have a personality type of IxTJ, you are likely to possess the right temperament for value investing. But if you don’t, that doesn't mean you don't have the temperament or you won't achieve superior returns. You just need to be more cautious of the weaknesses in your personality type that may lead to investment mistakes.
-- Grahamites, October 18, 2014
No doubt most of us are familiar with the above quote from Mr. Buffett. Probably most of us, as value investors, also think that we possess the temperament to control the urges. However, does our perception reflect the reality? How can we tell if we have the right temperament or not for investing? How do we define the right temperament?
Things can get complicated once we start asking ourselves these questions. Luckily, following Munger’s idea of simplicity, I think we can greatly simplify the problem by observing who has the right temperament and figure out their personality type through a well-known system. We can then figure out our own personality type and compare ours with those of say Buffett and Munger.
The aforementioned well-known system is called the Myers-Briggs Type Indicator (MBTI) assessment. According to Wikipedia, it is a “psychometric questionnaire designed to measure psychological preferences in how people perceive the world and make decisions.”
Essentially there are four dichotomies of psychological differences with a resulting of 16 possible psychological types. The four dichotomies are
- Extroversion (E) versus Introversion (I)
- Sensing (S) versus Intuition (N)
- Thinking (T) versus Feeling (F)
- Judging (J) versus Perception (P)
Each term used for each dichotomy has specific technical meanings and each combination of 4 (i.e. each type) has its own distinctive set of characteristics. For instance, “sensing and intuition are the information gathering (perceiving) functions. They describe how information is understood and interpreted. Individuals who prefer sensing are more likely to trust information that is in the present, tangible, and concrete and they tend to distrust hunches. On the other hand, those who prefer intuition tend to trust information that is more abstract or theoretical, that can be associated with other information. They may be more interested in future possibilities.”
Assuming the MBIT system is a good enough one for the discussion of temperament, let’s see if we know what type of person Buffett and Munger are. A little bit of google search combined with our observation and experience show that Buffett is most likely an ISTJ type while Munger is more likely an INTJ type.
Below are the descriptions of these two types from truity.com:
ISTJs are responsible organizers, driven to create and enforce order within systems and institutions. They are neat and orderly, inside and out, and tend to have a procedure for everything they do. Reliable and dutiful, ISTJs want to uphold tradition and follow regulations.
ISTJs have a serious, conservative air about them. They want to know and follow the rules of the game, and typically seek out predictable surroundings where they understand their role. You may find the ISTJ doing something useful even in social situations (for instance, organizing coats and hats at a party) as they’re often more comfortable taking charge of a task than they are chatting up strangers. When given something to do, they are highly dependable, and follow it through to the end.
INTJs are analytical problem-solvers, eager to improve systems and processes with their innovative ideas. They have a talent for seeing possibilities for improvement, whether at work, at home, or in themselves.
Often intellectual, INTJs enjoy logical reasoning and complex problem-solving. They approach life by analyzing the theory behind what they see, and are typically focused inward, on their own thoughtful study of the world around them. INTJs are drawn to logical systems and are much less comfortable with the unpredictable nature of other people and their emotions. They are typically independent and selective about their relationships, preferring to associate with people who they find intellectually stimulating.
The description may not fit perfectly with Buffett and Munger but I think we can all agree that they are fairly close. Munger and Buffett both share ITJ, which are introversion, thinking and judging. Just for a fun trivia, Bill Gates is also an INTJ type.
A good amount of readers on this forum should be this IxxJ pattern. It’s the F or T that should make the alarm sound for those of us who have more “F” than “T” in our types.
Again, the point of this exercise is not to say which personality type is better or worse. My educated guess is that if you have a personality type of IxTJ, you are likely to possess the right temperament for value investing. But if you don’t, that doesn't mean you don't have the temperament or you won't achieve superior returns. You just need to be more cautious of the weaknesses in your personality type that may lead to investment mistakes.
-- Grahamites, October 18, 2014