Some will argue that stock returns this year are a mirage caused by the
extremely accommodative monetary policy of the Fed, specifically QE.
Many investors seem to think when QE is taken away, the market will tank
and the economy will head back into a recession. I disagree with this
notion, as QE has not done what it was intended to do. Certainly it has
helped with sentiment, which is part of the reason for the stock rally,
but the intent of the Fed was not to just boost sentiment. The purpose
was to increase money supply by keeping interest rates low. However,
that money has not made its way into the economy because QE has had the
effect of flattening the yield curve, which gives banks less incentive
to lend, not more.
I believe the stock market rally this year had more to do with improving
fundamentals than QE. Heading into 2014, I remain optimistic on stocks
and the direction of the economy. I do not see anything on the horizon
that should cause an investor to make wholesale changes to their
portfolios, as long as the portfolio in question is a well-diversified,
properly constructed portfolio. I do not see any major shifts in
leadership in the stock market. So, just because it is a new year, I am
not changing my forecast, because the date means nothing to me and it
should not to you either.
I believe 2014 will be a year of accelerating growth in the economy and
another up year for stocks. Since WWII, the S&P 500 has had 18
annual gains of 20% or more and 78% of the years immediately following
those great years have been positive.
-- Mitch Zacks
[9/20/13] Investors partied all day and into the night on Wednesday thanks to the No Taper Parade. As they woke up Thursday morning they took a couple aspirins, looked in the mirror and decided they would do it all over again. Meaning that no taper = plenty of reason to rally in the short run.
Very little was given back Thursday as investors digested recent gains and are likely building up the energy to move towards 1750. Recent economic reports add to the luster of this rally such as evident in another very low Jobless Claims report and a Philly Fed report more than double its expected level.
Here is my prediction. I expect stocks to rush up to 1800 this year and then go a bit flat next year. Which is not such a bad thing 5 years into a bull rally. We had a flat year like that in 2011 and stock pickers like us did just fine.
Interestingly, there are parts of the globe where stock markets will push ahead 20%, 30%, even 50% next year. And many of the top stocks there will double and even triple that mark. If you have a good track record chasing down these top opportunities around the globe, then you are all set.
[9/16/13] Stocks are up for 8 out of the last 9 sessions including Friday the 13th in the plus column. And this is on top of a bull rally that has been charging ahead since March 2009.
Too often people underestimate how hard it is to turn a bull into a bear. You need much stronger ammo then what is available right now... especially as economic data is pointing to an accelerating economy.
Reity, any worries about the start of QE tapering at the 9/18 Fed meeting?
NO!!!
My guess is the QE taper will be announced at the 9/18 meeting. And given all the forewarning and market movement to date, then there should be NO reaction to the news. My guess is that the slate of Fed Governor speeches on Friday are there just in case investors get the wrong idea about their policy changes. So they will be at the ready to smooth out the message.
As you know I have no problem with the QE taper and continue to have my pedal on the floor as stocks are still the most attractive investment option at this time. Thus, I will be miffed if the weak hands loosen their grip on the bull once again.
Regardless, I am playing the obvious trend in front of me. If further gains get delayed, then I can patiently wait for them to come around.
[8/30/13] Recently strong economic activity has been met with lower stock prices because it meant the QE taper is coming sooner rather than later. Now we all know the taper is on the way. And so we can get back to a more NORMAL reaction to positive economic news as we did with Thursday's gains.
In particular, I am talking about Q2 GDP being revised up from 1.7% to 2.5%. That's a big deal. Also we got another printing of the weekly Jobless Claims under 350K which bodes well for another month of 150-200K jobs added. That will hopefully be on display next week when the key employment reports come out.
With Syria, the debt limit and a new Fed chair still unknowns, the market may not roar higher just yet. That is why choppy, range bound activity is likely in the of fing. But beyond this period of uncertainly lies greater odds for stocks to move higher.
I am 100% long in preparation for whenever other investors want join me in this logical conclusion.
[9/15/13 Mitch Zacks] There are plenty of reasons to believe the bull market that's been in
place since March, 2009 is about to come to a crashing end. The market
is up almost 150% since hitting a bottom. The earnings growth last
quarter was sluggish. The Fed is about to begin the end of its third
iteration of Quantitative Easing ( QE ). Energy Prices are rising. The
uncertainty surrounding the situation in Syria, which could end without
any military action taken against Bashar al-Assad's regime, is still
fluid and could escalate further. Even without military intervention
from the U.S. or its allies, the Syrian civil war that started in 2011
will continue. Investors pulled more than $20 billion from ETFs in
August, the largest monthly outflow since the first ETF was launched 20
years ago. Historically bull markets last five years on average and were
not too far away from hitting that mark. The unemployment number is
staying stubbornly high.
Pessimism Reigns
Any investor could be forgiven for wanting to sell their stocks and
flock to the comfort of cash or short-term treasuries given all the
pessimism that abounds right now. But right now might be time to be a
contrarian.
The items mentioned above have made for scary headlines, which the media
is won't to do. But there are also many positives regarding the economy
and global markets that are being ignored, or at least not talked about
much in the media. Not to mention the fact that these reasons for the
market and economy to crash have been talked and written about for a
some time now. At this point, they are most likely already priced into
the market.
Overlooked Positives
You'd have a hard time finding the following positive developments in
the mainstream media. Europe's economies rose out of a 22-month
recession two months ago. July's manufacturing PMIs broke 50, the
expansion number. August PMI's were even stronger. Japan's QE has
rekindled strong GDP growth. China's +7.5% annual growth is picking up
retail and industrial strength. Stock market highs have stimulated
discretionary purchasing.
Furthermore, the August JP Morgan Global Composite Output Index rose 1.2
points to 55, hitting a two and a half year high. The August U.S.
employment report showed aggregate hours worked rising 2.4% from last
year, despite disappointing job creation. The boost in hours worked is
consistent with the strength in the U.S. ISM production indices which
were the strongest since 2011. U.S. banks are healthy, with strong
balance sheets and rising profits. The U.S. is producing its own energy
resources and could become energy independent due to new technologies in
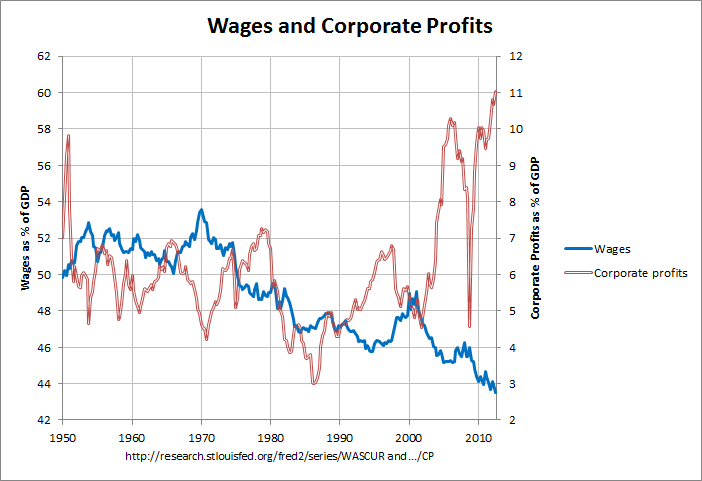
oil extraction and our huge supply of natural gas. Corporate profits
are at all-time highs and continue to rise. In the U.S. and abroad,
manufacturing is improving and retail sales are growing. Falling
inventories and rising new factory orders suggest growth is poised to
continue.
Putting it All Together
At the end of the day, there will always be weakness somewhere in the
economy. Right now however, I believe the positives far outweigh the
negatives and thus feel the economic expansion and bull market should
continue for the foreseeable future. I don't believe a full-blown market
crash is imminent, but you should expect more volatility ahead. When we
do finally see a correction, the headlines will get even scarier and
natural instinct will be to sell your stocks and take a defensive
position. It will be difficult but try to deny that urge and stick with
your long-term investment plan.
[8/28/13] Just as stocks seemed ready to head back to 1700+, investors got spooked by a new boogeyman... that being a potential armed conflict with Syria. The investment concern of such a venture, would be that oil prices would likely rise creating a burden for the economy. Also a new debt limit debate is starting to escalate.
Add the two together and it decreases visibility, which leads to greater caution, which leads to a pullback as you have seen the past two sessions.
Reity, how low do we go?
I remain long term bullish, but appreciate there is some short term concern. Tuesday's drop could be the end with a bounce coming. However, a quick shot down to 1600 followed by a bounce is probably more likely. If that doesn't hold, then the next serious level of support is the 200 day moving average at 1560. I am not terribly concerned about heading lower than that at this time.
However, as stated in the past... I don't want to bet on that happening. Too often we see the market jump a lot sooner as investors are still generally in a bullish mood (as they should be 4.5 years into a bull market). So I am willing to suffer the potential for some short term loss in my portfolio, just so the market doesn't jump higher without being properly 100% on board.
You can time the market if you like... I just won't be joining you at this stage for the reasons provided above.
[8/15/13] Bass Ackwards
I thought we were done with this backwards thinking. Yet it reared its ugly head again on Thursday as solid economic data means QE taper coming sooner which means that more chumps are bailing out of stocks.
AND WHERE WILL THEY GO?
Bonds offer too low of a yield. And their value will slip further as rates rise. NO THANKS.
Cash is still paying nothing. NO THANKS.
Gold is a store of money and with no inflation, then not much reason to rise. NO THANKS.
Real
Estate has been tempting some folks out of the wood works. But rising
mortgage rates may likely stall the advance in prices and thus dampen
the investment returns. Plus not everyone enjoys the complications of
this illiquid asset. NO THANKS.
So we are back to stocks being
the belle of the investment ball. And when this consolidation is over,
expect the bull market to continue with 1700 being a weighing station...
not final destination.
[7/9/13] Friday's
Government Employment Situation did the trick to get stocks back above
their 50 day moving average for the first time since mid-June. And that
bullish continued on Monday.
This begs the question: Is the Correction Over?
I believe the answer is YES based upon 3 simple, yet powerful reasons.
1) US economy continues to grow which will aide corporate earnings.
2) Bonds finally losing money with investors moving more money to stocks.
3)
The trend is your friend til proven otherwise. Meaning the 4 year bull
rally needs to be pushed out of the way for good reason... and that
reason doesn't currently exist.
Fight the trend at your own risk.
[6/7/13] There are many ways to access value. But one of best time tested methods
is reviewing the earnings yield of stocks versus Treasury bonds.
Traditionally there is a 3% spread between the 10 year Treasury and the
earnings yield of the stock market. Right now the 10 year is only at
2.1%. However, I suspect that as QE melts away the rate will float up to
more like 3%.
So that would mean that stocks should have a 6% earnings yield, which
translates into PE of 16.7 as fair value. Now multiply that by the $115
per share estimate I gave you for next year =
1920 fair value for the
S&P 500.
I am not saying it is worth that today. I am saying that is a reasonable
target for next year given the likely inputs on earnings and bond
rates.
[6/5/13] The
see-sawing market continues as we just endured our 7th straight session
without stocks moving in the same direction for two consecutive days.
Plus the decline on Tuesday marks the end of a 20 week streak of positive gains for stocks. That is the longest such streak since 1900 (not a typo).
Here
is what I see happening now. The Fed is being incredibly transparent
about their future intentions. Investors are making most of their
portfolio changes now so there will be little disruption when the actual
QE tapering begins.
When the smoke clears investors will realize that QE will be removed S-L-O-W-L-Y
as to insure that each incremental reduction does not derail economic
expansion or employment gains. And even with 10 year Treasury rates
floating back up to around 3%, stocks will be hard to overlook given a
healthy combination of dividend income and capital appreciation. That is
why I took Tuesday's dip as an opportunity to get back to 100% long.
Note
that the long term bull market is still intact. We are just going range
bound for a little while. However, if you focus on stocks with
ingredients to outperform (like Zacks #1 Ranks) then you can produce attractive returns while most other investors come away empty handed.
[6/3/13] Kevin Cook here to start the week off for Steve...
Last
week I made the argument that all the Fed QE3 "taper talk" would bring
enough worry and volatility to equity markets to make June the worst
month of the year (so far) for stocks. But this was also in the context
of one of the best bull runs ever for the first 5 months.
It
seems the last day of May got a jump on June with a 1.4% kerplunk. So
does Friday's sell-off and crack of short-term support at 1635 mean the
big correction is finally coming? I still don't think so.
There
is STILL pent-up demand for stocks in an environment where the US growth
story is the best place on the planet for investors' money. This means
that a dip to S&P 1600 will be bought aggressively after the weak
hands are shaken out.
Bottom line: Yes, there will be more
worry and caution as we head into the Fed meeting in 2 weeks. But my
bet is that 1560 will mark the lows for the summer and therefore
building positions anywhere near 1600 will be a good buy.
[5/28/13] Friday
was the second straight session that started in a deep hole. Then tick
by tick stocks worked their way back to nearly breakeven. There are 2
ways to interpret this action:
1) Last Throes of this Bull Rally:
Often when you have a market that has been on a long bullish run, you
will have a couple days just like these. And when the bull has to fight
back this hard, it often runs out of steam leading to further declines
in the days ahead.
2) Bullish Bias Continues: Sometimes
these tea leaves mean that investors REFUSE to become bearish. So they
turn every dip into a buying opportunity with more upside on the way.
Reity, which is it?
I
have to admit that it's a close call. But if you put a gun to my head
and demanded answers I would say 55-60% odds that the bullish bias is
the right choice. Unfortunately that means decent odds that we could be
in for a more prolonged pullback.
[5/26/13 Mitch Zacks writes] Japanese shares experienced their biggest drop since the Fukushima
nuclear disaster in March of 2011. There were two forces spurring the
sell-off. Most importantly, Chinese manufacturing data unexpectedly
contracted. Additionally, Bernanke indicated that the quantitative
easing, like all good things, must eventually come to an end. The
result was that the TOPIX Japanese index fell a disconcerting 6.87% in a
day.
The magnitude of the selling in Japan shows investors are having trouble
believing in the staying power of the rally. There is nothing that
happened fundamentally in one day to justify a nearly seven percent
downward movement in the Japanese market. With the TOPIX index up around
40% year to date, what essentially happened is that Japanese investors
are nervous because of the run-up and were looking for a reason to sell.
There is an undercurrent of skepticism built into this market. This
skepticism extends from institutional investors to individual investors.
Almost every investor I come in contact with believes, at some level,
that the current rally is not sustainable and that a sell-off is due. My
belief is that until this skepticism recedes, the market will continue
to move higher. What we saw in Japan
on Thursday
is this skepticism combined with profit taking. It was not a rational
response to what Bernanke said, and it wasn’t a rational response to the
Chinese manufacturing data. It was selling based on a catalyst because
investors believe the market has come too far too fast.
The wall of worry that has been built using the bricks of the 2008
financial crisis remains strong. This bull market will likely continue
to climb this wall of worry until there is an almost euphoria regarding
the stock market. We are not even close to being there yet. Bull markets
don’t end with a bang but with a whimper. Bull markets, in my
experience, end when there is almost universal acceptance that the
market is heading higher. For this reason, I am far more concerned by
the growing herd of Wall-Street strategists raising their end of the
year price-targets than with the Japanese sell-off.
Most substantial bull markets are also accompanied by new theories
trying to explain why the market should be hitting all-time highs and
why traditional P/E multiples are no longer a valid valuation metric. If
you think back to the bull market of the late 90’s there was an attempt
to try to find a means of valuing stocks that justified the high
prices. Even with the current rally, P/E multiples remain in line with
average levels. Although the market is hitting new highs, valuation
multiples are not hitting new highs.
As a result, if the economic recovery in the U.S. continues, then the
market should continue to appreciate at its annual historical rate of
roughly six percent above the risk-free rate of return. While some
consolidation would not be unheard of, as trees never grow to the sky,
ultimately the selling is relatively healthy and the events in Japan do
not change the underlying fundamentals of the U.S. recovery.
[5/20/13] At
this stage we would need a clearly negative catalyst to stop the market
from advancing to 1700 which is only 2% above Friday's close.
My
sense is that stocks will make it there and then a consolidation will
ensue with stocks trading in a range between 1600 and 1700. That means
you should start taking some trading profits as we approach 1700. Then
buy back lower in the range.
[5/5/13] Stocks
blasted above 1600 on a strong monthly jobs report. Not only was this
month above expectations, but even more impressive, last month was
revised higher by 50,000 jobs. This had stocks off to the races.
I
know it is hard to fathom how a higher than normal 7.5% unemployment
rate translates into stocks reaching record highs. That boils down to
the following:
1) The direction of the economy is more important
than the absolute strength of the economy. It has been improving for 4
years and that creates a positive investment environment.
2)
Don't Fight the Fed: QE has effectively pushed down bond rates to levels
that make all other forms of investment more attractive. Namely real
estate and stocks.
These are the trends that matter. It doesn't
mean that stocks will go up every day or week or month. And yes, this
bull may tire soon. But with the evidence in hand, then I will not be
selling this May. Nor will I be walking away. I am here for the stay.
[4/10/13] The
S&P 500 climbed to its third highest close in history in eager
anticipation of Q1 earnings. Making new highs should be a good thing, but why am I still so uneasy?
• Soft Economic Reports: Last week provided a Royal Flush of 5 soft economic reports including services, manufacturing and, most importantly, jobs.
• Every Bull Must Rest:
The market is up 10% year to date. Yet earnings growth will only be in
the mid-single digits. Yes, stocks can go up by more than earnings
growth as long as PE's expand. But there is only so much elasticity in
that equation.
• History Repeating Itself: In 2010, 2011
and 2012 the market raged higher up til April earnings season only to
get thwarted. And here we are in April 2013 sitting on a fat 10% gain.
It is eerily too similar to the recent past.
• Large Caps Leading the Way:
That is not a positive sign. Rather it says investors are more
interested in safety than risk taking. That is often a harbinger of a
bearish turn on the way.
This is my short term view of a
consolidation or modest correction in the midst of a long term bull
rally. Get ready to buy on forthcoming dips.
[2/7/13] Breakeven is Better Than ... Down.
That is the lesson from Wednesday's breakeven showing for US stocks. Even better is that shares were actually down a good spot early in the session before rising to the second highest close since the Great Recession.
What it tells you is that investors can’t find many good reasons to sell stocks. Even when they have rallied almost continuously for the last 3 months. The natural outcome of shares not wanting to go down is that they will probably keep heading higher.
1500 is becoming solid support. Next stop is likely the all-time highs at 1565. At that time I suspect stocks will be ready to rest.
[2/4/13] Friday
provided a Royal Flush of economic data to push stocks to a new closing
high at 1513. Most important of the bunch was impressive revisions to
November and December job adds that proves to be a very positive trend.
Then ISM Mfg told a tale of a re-accelerating manufacturing sector.
Simply
the bears are finding fewer reasons to stay committed to their
ill-fated cause. Plus fresh investor money is starting to come off the
sidelines. This likely spells more upside.
We are only 3.4% away
from the all-time highs at 1565. There seems to be a tractor beam
pulling us in that direction. Yet when we do arrive, expect serious
resistance and a likely good spot to take profits.
[1/16/13] Stocks started in the dumps Tuesday thanks to bad news from across the
Atlantic. There we find that Germany is not immune to the economic
malaise happening in the rest of Europe. Yes, their economy contracted
-0.5% in the most recent quarter.
US investors saw the red from overseas' markets and decided that was the
place to start for the States. Yet as the day progressed, stocks moved
back into the black. And now we find ourselves just 2 S&P points
away from the highs.
Typically a market that fights back from the red intraday is often on
its last legs. Then add in the uncertainty coming down the pike from the
Cliff 2 debt debates and it makes a case for a consolidation or
contraction period. As such, I started taking some profits on Tuesday.
Note this is just my short term read for the market. I still expect the
long term bull rally to continue once we get through the debt debates.
Trade accordingly to your investment time horizon.
[1/11/13] On Thursday we enjoyed the highest close since the Great Recession at
1472.12. That's just a smidge below the intraday high made on September
14th of 1474.51. We'll be there, and above, soon enough.
So Reity, it's just up and up and up from here?
Not so fast my friends. The next round of concerns will come when the
Fiscal Cliff 2 debates heat up in a couple weeks. That being the
government cost cutting measures, we should have tackled already, and
hitting the debt ceiling once again.
I suspect we will have more of the same kind of kerfuffle as with the
Cliff 1 discussions. That being a lot of faux anger and mock gnashing of
teeth by both political parties. Then in the final hours a deal will be
struck. During this "play fight" investors may get a little spooked
with a modest pullback in the works.
Likely stocks will continue their rise towards 1500 in the short run.
Then we might want to lighten the load a notch as the Cliff 2 theatrics
commence. And then we buy the dips with full expectation for the 4 year
bull market to continue on its merry course.
[1/3/13] Stocks soared to start off the New Year thanks to a Cliff deal finally
being in hand. The basic construct seems like a reasonable compromise
between the desires of the two parties. For me the spending cuts are too
light, hopefully we can see the appropriate level of belt tightening in
the next round of discussions.
All in all, this deal allows the US economy to stay on its Muddle
Through course. That, in conjunction with the attractive valuation of
stocks, should equate to more upside in 2013. That's because the market
will keep on the long term bull run until a recession is on the horizon
or stocks become overpriced.

