We’ve just done a study for the NYTimes on rebalancing, so the subject is fresh in my mind. Fact: a 48%S&P 500, 16% small cap, 16% international, and 20% bond index, over the past 20 years, earned a 9.49% annual return without rebalancing and a 9.71% return if rebalanced annually. That’s worth describing as “noise,” and suggests that formulaic rebalancing with precision is not necessary.
We also did an earlier study of all 25-year periods beginning in 1826 (!), using a 50/50 US stock/bond portfolio, and found that annual rebalancing won in 52% of the 179 periods. Also, it seems to me, noise. Interestingly, failing to rebalance never cost more than about 50 basis points, but when that failure added return, the gains were often in the 200-300 basis point range; i.e., doing nothing has lost small but it has won big. (I’m asking my good right arm, Kevin, to send the detailed data to you.)
My personal conclusion. Rebalancing is a personal choice, not a choice that statistics can validate. There’s certainly nothing the matter with doing it (although I don’t do it myself), but also no reason to slavishly worry about small changes in the equity ratio. Maybe, for example, if your 50% equity position grew to, say, 55% or 60%.
In candor, I should add that I see no circumstance under which rebalancing through an adviser charging 1% could possibly add value.
[via roberts1001 @ chucks_angels]
Tuesday, July 31, 2007
Monday, July 30, 2007
Grantham sees opportunity
Jeremy Grantham says he's spotted the third great investing opportunity of his career. The first was small caps in the 1970s. The second was real estate, Treasury Inflation-Protected Securities, and value stocks during the tech bubble in 2000. Before you get too excited, I should make clear that the main opportunity today, in Grantham's view, is getting out of the way and watching the markets plummet in what he calls a slow-motion train wreck. Grantham made this call in a report published July 25--a day before the Dow got 300 points sliced off the top (talk about instant gratification!).
Grantham calls this new opportunity "anti-risk." He says the opportunity lies more in bonds than stocks. "The ideal way of playing this third great opportunity is perhaps to create a basket of a dozen or more different anti-risk bets, for to speak the truth, none of us can know how this unprecedented risk bubble with its new levels of leverage and new instruments will precisely deflate. Some components, like subprime and junk bonds, may go early, and some equity risk spreads may go later."
I asked Grantham what else individual investors could do to make some anti-risk bets of their own. The wagers he's making for clients are too complicated for individuals, but he did offer a few ideas in addition to buying TIPS.
• Hold a lot of cash so that you'll have plenty of dry powder to take advantage of cheaper markets in years to come.
• Regular bonds are not too bad to own. (This means core high-quality bonds, such as corporate or Treasury bonds.)
• Short the Russell 2000 and go long on the S&P 500.
The final notion reflects Grantham's view that low-quality small caps will be terrible after many years of outperformance and high-quality large caps will fare well after years of lagging. The S&P 500 isn't a perfect proxy for GMO's definition of high quality, but it's close. Grantham notes that 80% of the companies they consider high quality are in the United States. "If the economy weakens substantially, these stocks will be pure gold," he said.
Percentage Retracements
In almost all uptrends and downtrends after a particular market move, prices retrace a portion of the previous trend before continuing the move in the original direction. Studies show these countertrend moves tend to fall into predictable percentage parameters.
The application best know in this phenomenon is the 50% retracement. For instance, a market is trending higher traveling from the 100 level to the 200 level. Most often, the subsequent reaction retraces half of the previous movement, to about 150, then regains its momentum and moves upward. This market tendency happens frequently and in all degrees of trend, such as, major and secondary. It also occurs in all trading systems including day trading, swing trading and options trading.
There are also minimum and maximum percentage parameters, one-third and two-third retracements, which are useful. Divide the trend into thirds, and site the minimum retracement as approximately 33% and the maximum as 66%. So when the corrections in the market retraces at least a third of its movement, the trader can compute a 33-50% area as a general frame for buying opportunities.
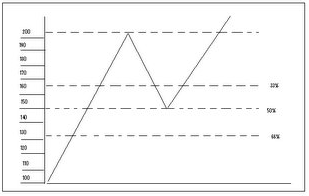
The 66% parameter becomes a critical area in the event the retracement enters that area. For the trend to be maintained, the correction must not go beyond the two-thirds mark. However, this 66% area becomes a relatively low risk buying area in an uptrend and selling area in a downtrend. Retracement beyound 66%, two-thirds, strongly indicates a trend reversal instead of just a retracement.
[via investwise]
The application best know in this phenomenon is the 50% retracement. For instance, a market is trending higher traveling from the 100 level to the 200 level. Most often, the subsequent reaction retraces half of the previous movement, to about 150, then regains its momentum and moves upward. This market tendency happens frequently and in all degrees of trend, such as, major and secondary. It also occurs in all trading systems including day trading, swing trading and options trading.
There are also minimum and maximum percentage parameters, one-third and two-third retracements, which are useful. Divide the trend into thirds, and site the minimum retracement as approximately 33% and the maximum as 66%. So when the corrections in the market retraces at least a third of its movement, the trader can compute a 33-50% area as a general frame for buying opportunities.
The 66% parameter becomes a critical area in the event the retracement enters that area. For the trend to be maintained, the correction must not go beyond the two-thirds mark. However, this 66% area becomes a relatively low risk buying area in an uptrend and selling area in a downtrend. Retracement beyound 66%, two-thirds, strongly indicates a trend reversal instead of just a retracement.
[via investwise]
Friday, July 27, 2007
America gives it away
According to a recent report from the Giving USA Foundation, in 2006, Americans donated $295 billion to charities -- a slight but impressive increase over 2005, which saw more than its share of (hopefully) once-in-a-lifetime disasters. (Back out the natural-disaster donations, and 2006 giving was up 3.2%.) Giving USA stats show that the United States ranks first worldwide in philanthropy, at 1.7% of GDP. (The United Kingdom is No. 2, at 0.73%.)
Saturday, July 21, 2007
US Equity Returns: What To Expect
Does one's entry level into the market, i.e. the valuation of the market at the time of investing, make a significant difference to subsequent investment returns?
In an attempt to cast light on this issue, an interesting multi-year comparison of the price-earnings (PE) ratios of the S&P 500 Index (as a measure of stock valuations) and the forward real returns was done by my colleagues at Plexus Asset Management. The study covered the period from 1871 to 2006 and used the S&P 500 Composite Index (and its predecessors). In essence, a total real return index and coinciding ten-year forward real returns were calculated, and used together with PEs based on rolling ten-year earnings.
In the first analysis the PEs and the ten-year forward real returns were grouped in five quintiles (i.e. 20% intervals) (Diagram A.1). The cheapest quintile had an average PE of 8,5 with an average ten-year forward real return of 11,0% p.a., whereas the most expensive quintile had an average PE of 21,6 with an average ten-year forward real return of only 3,2% p.a.
The study was then repeated with the PEs divided in smaller groups, i.e. deciles or 10% intervals (see Diagrams A.2 and A.3). This analysis strongly confirms the downward trend of the average ten-year forward real returns from the cheapest grouping (PEs of less than six) to the most expensive grouping (PEs of more than 21). The second study also shows that any investment at PEs of less than 12 always had positive ten-year real returns, while investments at PE ratios of 12 and higher experienced negative real returns at some stage.
A third observation from this analysis is, interestingly, that the ten-year forward real returns of investments made at PEs between 12 and 17 had the biggest spread between minimum and maximum returns and were therefore more volatile and less predictable.
Based on the above research findings, with the S&P 500 Index's current PE of 18.4 and dividend yield of 1.8%, investors should be aware of the fact that the market is by historical standards not in cheap territory, arguing for luke-warm returns. Although the research results offer no guidance as to when and at what level the current bull market will run out of steam, they do indicate that it would be irrational to bank on above-average returns from these valuation levels. As a matter of fact, investors should expect higher volatility and even the possibility of some negative returns.
Friday, July 20, 2007
Is the party over?
It may surprise you to learn that a slowdown in the growth rate of corporate earnings doesn’t necessarily mean the party’s over for stocks. Not only are earnings slowdowns natural at this time in the economic cycle, but history has shown the market actually has performed best during such periods.
That’s because the stock market looks ahead. Once investors believe the Fed is done raising rates, price/earnings (P/E) ratios tend to expand—unless they are already unrealistically high, which they’re not now.
That positive story, combined with low core inflation, could yet provide the fuel for another leg up in the market. In such late-cycle rallies, history also suggests that growth and large-cap stocks tend to be market stars.
Thursday, July 19, 2007
Morningstar looks at China
Visiting China in 2007 is a bit like visiting Silicon Valley in 1999 at the height of the dot-com era. Things are happening at light speed, and the economy is white hot here, but caution is certainly warranted. The economy has grown at a 10%-13% rate for several years in a row, and on a purchasing power parity basis (excuse the economist-speak), the Chinese economy now has a GDP of about $10 trillion, trailing only the EU and the U.S. at roughly $13 trillion each. (After adjusting for currency effects, the actual value is much lower, but that's another story.) The bottom line is that like it or not, you cannot be a student of the modern world economy without taking time to study China. It is simply too large a force to be ignored.
Wednesday, July 11, 2007
Jean-Marie Eveillard is back
Jean-Marie Eveillard is back at First Eagle Fund. He just wrote his first shareholder letter reiterating his views on value investing.
First, a reminder: for more than twenty-five years, we have been in the business of establishing “intrinsic” values for securities which catch—on a preliminary basis—our attention. In a nutshell, we try to figure out what a somewhat knowledgeable buyer (“somewhat”, because we’re on the outside, looking in), expecting a reasonable long-term return, would be willing to pay —in cash—for the entire business. That number is the intrinsic value. If the market price of the security is at some discount to the intrinsic value, then we might be interested. The appropriate size of the discount is a function of how well we think we understand the business and of how much we like the business. The better we understand and like it, the smaller the required discount. As for the sale of securities, it takes place whenever we realize that our intrinsic value was overstated, in other words, when our analysis was flawed. We also sell when the price of the security moves up to the intrinsic value, though we make exceptions—not without trepidation—when we believe the odds are good that the business will continue to create value over the years.
This investment approach—the value approach—is not a recipe, a formula, a black box. But I believe it is a sound approach. As Seth Klarman, a successful value investor, has said, a long-term orientation is the biggest edge a value investor can have. Or, as Benjamin Graham put it, short-term the market is a voting machine, long-term it’s a weighing machine. In other words, we’re not interested in the psychology of the market. We’re interested in the realities of a business. We play bridge, not poker, the difference being that there is much less luck associated with bridge than there is with poker.
Monday, July 09, 2007
Two Surprises are better than one
A new study suggests investors who use earnings surprises the right way can double the market's average return of 10 percent a year. That's a profitpalooza: Invest $10,000 for two decades, and it's the difference between $383,000 and $67,000.
The finding is based on an oddity that researchers have written about since the 1960s, called post-earnings announcement drift, or PEAD. Simply put, stocks don't fully "price in" good earnings news immediately after it's released. They tend to jump right away, and then gradually drift higher for up to a year. PEAD has done more than perhaps any other financial phenomenon to blow holes in the notion that markets are perfectly efficient.
That said, strategies based solely on PEAD aren't as profitable as they used to be. Earnings surprises these days, for one thing, are smaller than they were decades ago. More pros are scrutinizing larger volumes of information now, and more analysts contribute to estimates. Wall Street has gotten better at figuring out how much companies will earn next quarter. (Or perhaps, companies have gotten better at hinting.) Recent studies show that investors who buy after upside-earnings surprises can expect to beat the market by around three percentage points over the following six months.
Enter Narasimhan Jegadeesh. A finance professor and market researcher, he has consulted for and sold stock-picking models to Morgan Stanley and Deephaven Capital Management, a Minnesota hedge fund. Today he teaches investing at Emory University, occasionally playing point guard in basketball games against his Ph.D. candidates. (Undergrads run too much, he says.) Earlier this year Jegadeesh, along with Joshua Livnat, who teaches accounting at New York University, published a groundbreaking paper in the Financial Analysts Journal.
The study focuses on separating high-quality surprises from lower-quality ones. A soft-drink maker might crush estimates thanks to runaway demand for its energy drink (think Hansen Natural). That's clearly good news. A tire maker may top estimates even while selling fewer tires if it steers customers toward the most expensive ones and cuts jobs (Goodyear). That's okay, but it may not send the stock on a prolonged run.
How, then, can we tell the good earnings surprises from the not-so-good ones? Look at sales. A company that's ringing the register more has better momentum than one that's merely cutting costs. Also, studies show that instances of numbers massaging are higher among companies that miss sales forecasts but beat earnings estimates.
Jegadeesh and Livnat looked at earnings announcements from 1987 to 2003 and assumed stocks were bought a day after the news hit and held for six months. The 20 percent of stocks that had the biggest positive earnings surprises beat the market by three percentage points over six months. The top 20 percent in terms of sales surprises beat by 2.6 percentage points. Zero in on companies that turn up in both groups, according to the findings, and you'll top the market's return by 5.3 percentage points over six months.
Friday, July 06, 2007
Carlos Slim overtakes Bill Gates
The Mexican financial Web site Sentido Comun has reported that 67-year old Mexican telecom tycoon Carlos Slim Helu has overtaken Microsoft founder Bill Gates as the richest person in the world.
The Web site reported that Slim’s wealth had passed Gates following the superior performance of Slim’s telecommunications firm, America Movil. The Web site also stated that Slim’s lead over Gates amounted to billions of dollars.
"The difference between their two fortunes is around nine billion dollars in favor of Slim,” the financial Web site reportedly stated, owing Slim’s gain to a 26.5 percent rise in the shares of America Movil during the second quarter.
In addition to America Movil, Slim, the son of Lebanese immigrants, controls the INBURSA financial group and the Grupo Carso industrial firm.
In April, Forbes magazine pegged Slim’s wealth at $53.1 billion and Gate’s at $56 billion.
Among Slim’s most notable investment decisions is the one he make in 1997 when he bought 3 percent of Apple Computer at $17 a share shortly before the company launched its iMac computer. Twelve months later, Apple’s shares exceeded $100.
© 2007 Associated Press