So many wonderful retrospectives were written about Marty Whitman during his lifetime that another seems superfluous—yet we just can’t help ourselves.
Whitman, the founder of Third Avenue Management, died last week at the age of 93.
To financial journalists, he was a generous source and teacher about
value investing, especially deep value, the kind that really meant
investigating a company. He often picked up the phone to share an idea
in his gravelly New York voice, or to critique a story. In fact, he
loved teaching: He instructed students at Yale School of Management for
decades and endowed the Whitman School of Management at Syracuse
University.
For investors in his funds, he produced great returns for years and
wrote pungent shareholder letters that rivals studied closely. (One from
2013 called the work of that year’s Nobel Prize winner Eugene Fama
“utter nonsense” and “unscholarly.”)
Whitman focused on distressed debt years before it became
popular. He believed in the primacy of the balance sheet versus the
income statement, and read debenture documents as though they were comic
books. He believed that companies were wealth-creating machines, partly
through what he called “resource conversion,” including mergers and
acquisitions and spinoffs. And he rarely sold his stocks. “The idea of
selling was absolute anathema to him,” says Amit Wadhwaney, co-founder
of Moerus Capital and a protégé.
All of this contributed to him beating the stock market by a wide
margin over at least 20 years. He was “like a kid in a candy store when
markets were imploding, says Curtis Jensen, a portfolio manager at
Robotti & Co. and another protégé. “He was jogging into the trading
room hourly to buy stocks that were getting marked down during the
Long-Term Capital Management and Russian ruble crisis.”
Before he became a money manager, Whitman was an investment
banker who did a hostile takeover of Equity Strategies, a closed-end
fund. This became the foundation for Third Avenue Management, which
opened its doors in 1986. Once Whitman bought the bankrupt bonds of
Anglo Energy, he needled his lawyer, Tony Petrello, to join the new
company, asking him, “Do you want to be a principal or an advisor?”
Petrello eventually became CEO of Nabors Industries, one of the biggest
drilling companies. Whitman served on the Nabors board until 2011.
“Better than most,” says Jensen, “he emphasized that only three
to four variables counted in what would drive an investment: The rest
is just noise.”
Whitman stepped back from his firm in 2012.
Third Avenue has stumbled in recent years, ironically after a downturn
in distressed debt sank its Third Avenue Focused Credit fund. Value
investing has also struggled since the financial crisis. Assets fell. In a 2015 interview with Barron’s,
Whitman said, “I don’t know if you could even call us a success after
the 2008 redemptions. We never really came back. It’s been tough.”
Born and raised in the Bronx, Whitman favored sweatshirts and khakis
for the office, and forthright, sometimes salty language. Once, chatting
with Barron’s about a famous bankruptcy investor, he said,
“The bankruptcy fraternity here is very small. [This person] goes out to
dinner with them and schmoozes them. In this country, you litigate by
day and fornicate by night. He’s very good at fornicating by night. I go
home to my wife and children.”
Throughout his 70s, Whitman walked across Central Park daily to
the office and back. He had a habit of running across intersections if
the traffic light was about to change. In mid-conversation, he might
break into a dead run to catch a train. In his later years, he sometimes
announced to people, “Let’s make money the old-fashioned way.”
Now, investors must figure out how to do by themselves.
Monday, December 10, 2018
Sunday, December 09, 2018
Buffett: 50% a year
“If I was running $1 million today, or $10 million for that matter, I’d be fully invested. Anyone who says that size does not hurt investment performance is selling. The highest rates of return I’ve ever achieved were in the 1950s. I killed the Dow. You ought to see the numbers. But I was investing peanuts then. It’s a huge structural advantage not to have a lot of money. I think I could make you 50% a year on $1 million. No, I know I could. I guarantee that.”
-- Warren Buffett
-- Warren Buffett
Berkshire Hathaway track record
Warren Buffett has built a fantastic track record at Berkshire Hathaway,
achieving a 20.9% return per year in 53 years, or a 2,404.748% total
accumulated return. He did this buying great businesses at reasonable
prices. He used insurance leverage, he took advantage of fiscal
efficiency and he never paid a dividend.
His strategy evolved over time, as assets grew and he listened more to his partner, Charlie Munger (Trades, Portfolio).
He focused on buying great businesses at reasonable prices. He did that
investing in publicly traded equities but also in taking over
businesses and bringing them under the Berkshire umbrella.
The 50% remark
But when Buffett made the “I think I could
make you 50% a year” remark, he was not talking about managing a
portfolio of many billions of dollars. He was talking about managing a
few million dollars and having the “privilege” of investing in small and
illiquid companies.
Buffett invested in this arena when he
started his career in the 1950s. In 13 years, he did not achieve a
record of 50% per a year (that could probably demand extreme portfolio
concentration), but he managed to get close to a remarkable 30% a year.
But more than just that, he achieved those returns with a portfolio
management structure that maximized returns while controlling risks.
Clues to this type of portfolio management can be found in the master’s published Partnership Letters.
These contain valuable insights into implementing investment
strategies, identifying individual opportunities and actively managing
portfolios.
The Partnerships' track record
Between 1957 and 1969, the Buffett
Partnerships achieved an annual compound return of 24.5% net of fees
(29.5% before fees). The annual return of the Dow over the same time
with dividends was 7.4%. The Partnerships charged no management fee,
took 25% of any gains beyond a cumulative 6% and agreed to absorb a
percentage of any losses.
Generally, fund managers look to properly
diversify their portfolios among sectors and geographies. And more often
than not, they tend to stick to one process of investment selection.
The problem is that over time, certain investment methods tend to be
favored and others neglected.
Having a portfolio structure composed of
three different investment strategies allowed Buffett to consistently
approach the set of market opportunities with different lenses and
choose the most convenient for long-term profit maximization and
risk-exposure control.
Three investment strategies
Buffett’s system for managing the
Partnerships was composed of three strategies, and each investment in
the portfolios was cataloged with one strategy label. The strategies he
pursued were: generals, workouts and controls.
They all had in common the fact that
Buffett was looking for extreme cheapness and that he was looking mostly
in the camp of small or micro caps. But each strategy accomplished one
objective, and he masterfully managed the weight in each one according
to where the opportunities appeared.
The "generals” category referred to
undervalued stocks, the "workouts" category were the investments in
special situation events and "controls," although rare, were the
investments where the Partnership assumed, over time, an activist
position, trying to get management to make moves that would maximize the
value of the stock.
Over the next few articles, I will dissect
each of these strategies and provide an overview of their adaptation to
today’s investment scene.
Saturday, December 08, 2018
why all the selling?
Little changed fundamentally over the past two weeks with regard to interest rate expectations, earnings expectations and the potential length of a trade war with China. So why did the last week of November witness some of the strongest historical returns in quite some time and this past Tuesday saw some of the harshest selling in several years?
To understand what is going on you need to focus on psychology. There has been ongoing research trying to explain market sell-offs. Several researchers had an interesting idea to try to explain why intense market selling occurs: instead of looking for an economic explanation - a repricing of earnings due to a policy change or changing expectations of future interest rates - why not instead go and ask institutional investors why they sold during the market downturn.
The findings were fascinating but not surprising - what they discovered is the main reason large institutional portfolio managers sold during market corrections is that stock prices were falling. Investors were reacting to price movements instead of to changing fundamentals - the selling effectively snowballed because large institutional investors sold stocks because other large institutional investors were selling stocks.
The problem for today's market is that this lemming-like behavior of selling stocks because others investors are selling stocks is becoming a self-fulfilling prophecy due to algorithmic trading. If we look at a sample of three of the largest multi-strategy hedge-funds they might collectively manage only $100 billion dollars in assets but through leverage they can deploy half a trillion dollars. Additionally, most of these firms are focused on using leverage to generate returns on a very short-term time horizon.
Essentially, multiple firms, by analyzing past price movements independently through various means, have come to the same conclusion that the psychologists examining market corrections came to - that during large negative market movements selling accelerates.
The key lesson for investors is relatively straightforward - as much as possible try to ignore price movements when making buy and sell decisions and instead focus on changes in fundamentals. The silver lining in the increased volatility is that the higher volatility should result in a higher rate of return for long-term equity investors as they need to be compensated for the volatility which does not look like it can be diversified away.
-- Mitch on the Markets, 12/8/18
Friday, December 07, 2018
America oil exporter
America turned into a net oil exporter last week, breaking almost 75 years of continued dependence on foreign oil and marking a pivotal -- even if likely brief -- moment toward what U.S. President Donald Trump has branded as "energy independence."
The shift to net exports is the dramatic result of an unprecedented boom in American oil production, with thousands of wells pumping from the Permian region of Texas and New Mexico to the Bakken in North Dakota to the Marcellus in Pennsylvania.
While the country has been heading in that direction for years, this week’s dramatic shift came as data showed a sharp drop in imports and a jump in exports to a record high. Given the volatility in weekly data, the U.S. will likely remain a small net importer most of the time.
“We are becoming the dominant energy power in the world,” said Michael Lynch, president of Strategic Energy & Economic Research. “But, because the change is gradual over time, I don’t think it’s going to cause a huge revolution, but you do have to think that OPEC is going to have to take that into account when they think about cutting.”
The shale revolution has transformed oil wildcatters into billionaires and the U.S. into the world’s largest petroleum producer, surpassing Russia and Saudi Arabia. The power of OPEC has been diminished, undercutting one of the major geopolitical forces of the last half century.
Sunday, November 18, 2018
stock market ignorance
Friday's column
advocated self-awareness. The stock market's movements seem to be
meaningful, but their signals are spurious. Therefore, investment wisdom
consists of learning to avoid the temptation to trade. The investor who
acknowledges his ignorance is better off than the investor who does
not.
A reader, Marvin Menzin, noticed. "Your advice implies that investors should buy and blithely hold. It ignores the possibility they might want to reduce your exposure because of excess stock-market valuations. I think it would be an excellent column if you were to address when investors should rebalance to lower-risk portfolios, especially when it's a retirement account and taxes are not germane. Investors are told to stay the course. The Titanic stayed the course!"
Well, Mr. Menzin, this is that column. Although I must confess, the "when" is exceedingly rare. Since World War II, I can think of only one clear and obvious occasion when U.S. stock investors should have reduced their exposure.
To start: A portfolio's stock position should indeed be traded regularly, through mechanical rebalancing. If stocks perform well, such that a portfolio that was initially 60% stock/40% bonds becomes 70/30, then it's logical to return to the original allocation. After all, nothing changed from the initial decision.
Rebalancing, however, is more easily said than done, because while maintaining a consistent asset allocation makes economic sense, it's not much fun to implement. Selling winners feels good if stocks then decline, but if they do not, the opportunity cost can sting. Worse yet is the opposite situation. Mr. T had one word to describe how people feel after they buy equities when the headlines are urging otherwise, only to see stocks fall further. Pain indeed.
Thus, rebalancing is best done automatically: Establish a trading rule; follow its instructions devoutly; and suffer no regret if the transaction turns out badly. After all, the decision was the model's, not yours.
Unfortunately, I do not see how mechanical processes can guide investment strategies that are based on stock-market valuations. Those who have tried--most famously by using the Shiller CAPE P/E Ratio, which examines stocks' cyclically adjusted price/earnings ratios--have failed. Such measures work well in hindsight, but they have not been useful predictors. Their explanatory power has been academic rather than actual.
Historical Assessments
For 20 years following the conclusion of World War II, there was no judgment to be applied. Remaining in equities was the correct decision.
Then came 15 terrible years, through the mid-1980s, when the stocks were devastated by inflation. For that stretch, investors would indeed have done well to avoid equities. However, making that choice involved understanding the economy, not judging the level of equity valuations. It wasn't that stock prices were particularly steep. It was instead that inflation spiked far higher than it had been, and also far higher than it would become.
Since the early 1980s, stocks have crashed three times.
Two of those occasions, I believe, were almost impossible to anticipate. Black Monday in 1987 came out of nowhere; even in hindsight, it is difficult to understand why. The 2008 financial crisis, on the other hand, happened for well-documented reasons. But once again, the determinants were economic. Across the globe, banks collapsed and housing markets sunk. No stock-market indicator could have anticipated that.
The one occasion in which judgment served was during the "New Era," when technology stocks posted valuations that still exceed all subsequent levels. Sentiment was equally overheated. That truly was a time to slash one's stock-market exposure. Even then, though, the timing needed to be right. Those who sold equities in 1996 fared worse than those who stayed the course and held through the worst of the downturn.
In short, Friday's column overstated its case. Sometimes stocks do cost too much. But recognizing when that situation arises, and profiting from the knowledge, is a severe task.
-- John Rekenthaler
Wednesday, October 31, 2018
Schwab Choiceology
[5/17/18] Choiceology with Dan Heath
What happens when intuition fails us? Listen in as Dan Heath shares stories of irrational decision making—from historical blunders to the kinds of everyday errors that could affect your future.
Choiceology, an original podcast from Charles Schwab, explores the lessons of behavioral economics, exposing the psychological traps that lead to expensive mistakes.
Episode 1
We can’t all be above average. So why, in certain situations, do we think we’re so special?
Episode 2
It's not always about life-changing decisions—sometimes small changes can make a big impact.
Episode 3
Imagine that you’ve put in effort toward a goal, but things haven’t quite worked out the way you hoped. How do you know when it’s time to let it go?
Episode 4
In a world awash in data, you’d think it would be relatively easy to make informed, objective decisions. But not if you only see what you want to see.
Episode 5
News reports sometimes make it seem as if danger lurks around every corner. And while there’s no doubt that risk is a part of life, do we worry more than we should?
Episode 6
Focusing on a single data point to the exclusion of other information: It’s a tried-and-true negotiating strategy, and it can quickly skew your judgment.
Episode 7
Whether expecting joy or despair, we tend to overestimate the long-term emotional impact of life events.
Season 2 trailer
Season 2 of Choiceology is coming soon! Dan Heath hands the reins over to new host Katy Milkman for this season. Katy brings an incredible depth of knowledge to the show through her work as a professor of Operations, Information & Decisions at The Wharton School. You’ll hear from sports stars, Nobel laureates and everyday people making life-altering choices, and Katy will share useful tools and strategies to improve decision making in your own life. Subscribe for free today on Apple Podcasts, Google Podcasts or wherever you listen. Season 2 launches October 29.
Season 2, episode 1
From ethical behavior to athletic competition, the disproportionate drive not to lose can lead to major mistakes.
Winning
feels good. Whether it’s nailing a tricky golf shot or landing a big
client for your firm, it’s nice to come out on top. But is it the thrill
of victory that pushes you to sink that 10-foot putt or compels you to
put in a few extra hours at work? Or is it the fear of losing that motivates you more?
In this episode of Choiceology with Katy Milkman, we examine a bias that affects the irrational way people often react to gains and losses.
Season 2, episode 2
Why is it so tempting to make short-sighted decisions? And what we can do to exert more self-control?
In this episode of Choiceology with Katy Milkman, we examine a bias that affects the irrational way people often react to gains and losses.
Season 2, episode 2
Why is it so tempting to make short-sighted decisions? And what we can do to exert more self-control?
Monday, September 17, 2018
How to lose money in the stock market
[9/17/18] Charlie Munger, the Vice Chairman of Berkshire Hathaway and Warren Buffett’s partner, has a favorite piece of advice, which is to always invert. What he means by that is that we should figure out what we don’t want to do and avoid it in order to get the result that we want. Let’s apply his advice by answering the following question:
What is the most certain way to lose the most money investing in stocks?
1. Invest in Bad Businesses:
Pick businesses in tough, unpredictable industries with rapid change. Make sure they also lack any competitive advantage.
How this helps you lose money:
Investing in businesses that are both subject to rapid change and lack a competitive advantage increases the odds that the business is likely to be a lot less profitable in the future.
2. Invest with Bad Management Teams:
Look for management teams that are trying to make money off of you as opposed to with you, and are skilled at transferring wealth from shareholders to themselves. Lacking any of those, look for teams that are demonstrably bad at both operations and capital allocation.
How this helps you lose money:
Just in case the business managed to make some profits despite your best effort at selecting a bad business, this helps to ensure that the profits will either go to the management team or be squandered by it rather than end up in your pocket.
3. Invest in Companies with Too Much Debt:
Find companies that have so much debt that any adverse development is likely to cause financial distress.
How this helps you lose money:
On the off chance that the management team you carefully chose for its avarice and incompetence left you some money, having too much debt will make it likely that that money will go into the pockets of creditors rather than your own.
4. Pay Too High a Price:
Make sure to pay way more than the intrinsic value of the business.
How this helps you lose money:
If despite your best efforts some money made its way from the business to you, its owner, this will help you to make sure that your rate of return will still be low.
5. Focus Only on the Short-Term:
Don’t think about long-term economics, just focus on short-term trading considerations. (For more on this topic, see How and Why to Be a Long-Term Investor.)
How this helps you lose money:
Shares more of the little money you have managed to get out of your investment with your broker and tax collector.
These are five of the biggest mistakes investors make in the stock market. As Charlie Munger likes to say “Tell me where I will die so that I never go there” – avoid all of the above mistakes, and it will be a lot harder to do poorly at investing.
***
[2/17/16] There is no doubt that despite the ups and downs of the stock market, it is one of the best way to build wealth over the long-term. Fidelity recently conducted a study as to which accounts had performed the best. What they found interestingly, was that they were dead or had forgotten they had an account at Fidelity! In essence, if you want good investment performance, forget you have an account.
If it is this simple, why does the average investor fare so poorly? It almost always comes down to the fact that our minds work against us. Nothing gets in the way of returns like someone who thinks they can beat the market with a great idea. These 3 mistakes are the most common that new and experienced investors make when it comes to investing and sure-fire ways to lose your money in the stock market.
Mistake 1 – Day Trading. Many believe that buying and selling stocks within a trading day is an easy way to make big profits through small intraday price movements. According to a recent study, over 90% of day traders lose money with the rest breaking even. Only a very small percentage make enough money to do it full-time. Why? Day trading is expensive. If you make 20 round-trip trades a day over the 250 trading days in a year, that will be 5,000 total trades, or 10,000 individual buy and sell trades. If you pay $10 per trade, that is $100,000 in commissions! So even if you make $100,000 in profit day trading, it will all go to commissions! Trading is a zero-sum game. This means that in every trade between two parties, one will win and the other will lose. Professional investment firms have spent millions of dollars to install cables to make their trades nanoseconds faster. Why? By doing this they have a leg up in trading, called “high-frequency trades”, to take advantage of the trends. The odds are stacked against day traders. It is better to leave the trading to professionals and be an investor.
Mistake 2 – Option Speculating. Options can be easy to learn by very difficult to master and extremely risky. Options are also known as derivatives since it “derives” it value from something else. An option is a contract that gives the buyer the right, but not the obligation, to buy or sell an asset at a specific price on a certain date. Using options in a conservative can potentially provide some downside protection and produce a stream of income. However many try to speculate with options in hopes of making lots of money in short period of time. In every situation that I have dealt with, the investor using options instead has lost everything. As I mentioned in mistake 1, investing is zero-sum, so chances are the person on the other side of the options trade is much more experienced. Is there potential to make tons of money? Sure. Is it likely? Not at all.
Mistake 3 – Buying Penny Stocks. I constantly see all kinds of advertisements about how penny stocks can guarantee 500% returns on a penny stock. While there have been some penny stocks have hit it big, it is very rare. Many of these recommended penny stocks trade for as little as $0.0001 per share and the company recommending it look to pump then dump the stock. Some companies will even pay PR firms and analysts to cover it to make it legitimate and when unsuspecting investors take the bait, the company walks away with a nice profit. Anyone heard of the movie “The Wolf of Wall Street?” Perfect example.
Investors lose money when they try to make a quick buck or let their emotions gets the best of them. Building long-term and stable wealth takes time. If it sounds too good to be true, chances are it is!
-- Midweek, February 10, 2016
Thursday, August 30, 2018
top five in 2009
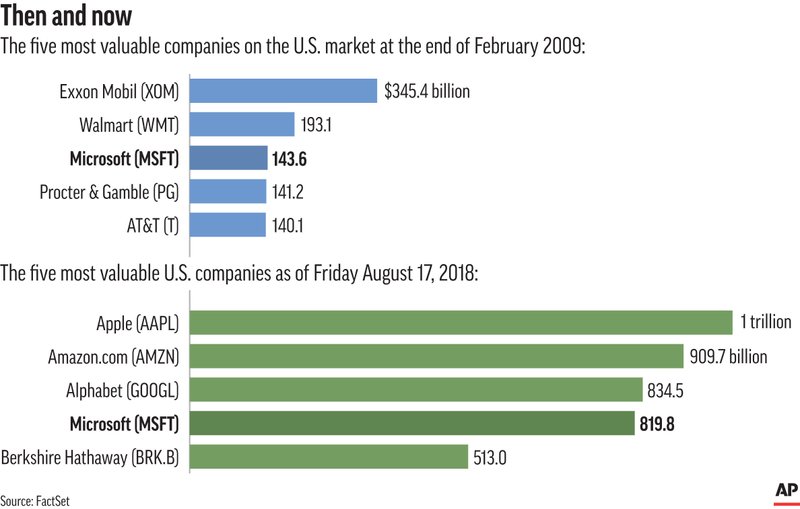
NEW YORK (AP) — The most valuable American companies at the start of
the current bull market included an oil company and retail and consumer
goods giants, and just one technology company.
The ranking seems very traditional, even a bit old-fashioned, compared to today, when big technology companies dominate the top of the market.
The top five most valuable companies at the end of February 2009 — Exxon Mobil, Walmart, Microsoft, Procter & Gamble and AT&T — includes several in sectors that are generally considered safe, a reflection of investors’ anxieties at a time the market was suffering huge losses.
Today, the top four most valuable companies on the U.S. market are concentrated in technology. They’ve used innovations in commerce, communications and software to change how people spend their time and money, and how they work.
Apple’s iPhone debuted in 2007 and was a fairly new product when the
market hit its low point in early 2009. Today, it’s the source of most
of Apple’s revenue. Thanks in part to steady sales and the high
profitability of the phone, Apple became the first public company valued
at $1 trillion earlier this month.
Exxon, P&G, Walmart and AT&T remain among the most valuable companies on the market, but only one company that held a position in the top five in 2009 is still there today: Microsoft, which made huge gains in recent years by branching out into cloud computing.

Amazon, currently the second most valuable U.S. company at $925 billion, may have shaken up more industries than any other. Its focus on fast shipping and delivery to customers has forced companies that sell clothes, groceries, electronics and other goods to follow suit — or risk falling out of favor with investors. Amazon was worth less than $30 billion back in March 2009.
Alphabet has made steady gains during the bull market as Google came to dominate the online search market and the advertising revenue that comes with it. Alphabet also runs several smaller tech businesses including Waymo, a self-driving car company.
Warren Buffett’s conglomerate Berkshire Hathaway is a bit of an anomaly at the top of today’s market.
Berkshire does own a big chunk of Apple stock but isn’t particularly
focused on technology. It owns several insurance companies and has
investments in railroads, airlines, banks and Coca-Cola. The firm’s
value has more than tripled during the bull market as investors rewarded
it for deals including its purchase of Precision Castparts and Heinz
Foods, which then combined with Kraft.
The ranking seems very traditional, even a bit old-fashioned, compared to today, when big technology companies dominate the top of the market.
The top five most valuable companies at the end of February 2009 — Exxon Mobil, Walmart, Microsoft, Procter & Gamble and AT&T — includes several in sectors that are generally considered safe, a reflection of investors’ anxieties at a time the market was suffering huge losses.
Today, the top four most valuable companies on the U.S. market are concentrated in technology. They’ve used innovations in commerce, communications and software to change how people spend their time and money, and how they work.
Exxon, P&G, Walmart and AT&T remain among the most valuable companies on the market, but only one company that held a position in the top five in 2009 is still there today: Microsoft, which made huge gains in recent years by branching out into cloud computing.
Amazon, currently the second most valuable U.S. company at $925 billion, may have shaken up more industries than any other. Its focus on fast shipping and delivery to customers has forced companies that sell clothes, groceries, electronics and other goods to follow suit — or risk falling out of favor with investors. Amazon was worth less than $30 billion back in March 2009.
Alphabet has made steady gains during the bull market as Google came to dominate the online search market and the advertising revenue that comes with it. Alphabet also runs several smaller tech businesses including Waymo, a self-driving car company.
Warren Buffett’s conglomerate Berkshire Hathaway is a bit of an anomaly at the top of today’s market.
Tuesday, August 07, 2018
Fidelity zero cost funds
Fidelity shook the investment landscape
last week when it announced that it would offer two index funds with
zero expense ratios: Fidelity Zero Total Market Index (FZROX) and Fidelity Zero International Index (FZILX).
And not months in the future, but right away--they went live on Friday!
Also striking is that Fidelity removed investment minimums.
I have a couple of thoughts on why Fidelity would do this and what it means for investors. I'll start with the industry view first.
Loss Leaders
I have a couple of thoughts on why Fidelity would do this and what it means for investors. I'll start with the industry view first.
Loss Leaders
Schwab and Fidelity can afford to offer index funds below their cost because they will make it up with all the other funds and brokerage services that clients will buy. Fidelity has a unique position in the industry in that it is a big player in brokerage, 401(k)s, and both actively and passively managed funds. In addition, Fidelity has always wanted to be the biggest and best. Other parts of the business remain quite profitable. In fact, Schwab and Fidelity have been pushing costs higher in their No Transaction Fee networks by charging fund companies--not investors--ever more to be on their platforms. Thus, I would guess Schwab will follow suit with its own fee cut.
Monday, August 06, 2018
How to start investing
Weeks ago, we posted an infographic that provided an easy introduction to investing, and why it should be a priority.
But how does one actually get into the market?
Today’s infographic is a practical guide that explains and compares four different ways to get started:
Picking Stocks
Picking Managers
Picking Index Funds
Hire a professional planner
But how does one actually get into the market?
Today’s infographic is a practical guide that explains and compares four different ways to get started:
Picking Stocks
Picking Managers
Picking Index Funds
Hire a professional planner
Saturday, August 04, 2018
One Trillion Dollars
The maker of the iPhone and other gadgets became the world's first
publicly traded company with a market value of $1 trillion on Thursday.
The company reached the milestone a couple of hours into the trading session when its shares reached $207.04. They closed with a gain of 2.9 percent to $207.39. The shares are up 23 percent so far this year.
The achievement seemed unimaginable in September 1997 when Apple teetered on the edge of bankruptcy and founder Steve Jobs rejoined the company. If someone had dared to buy $10,000 worth of Apple stock at that point of desperation, the investment would now be worth about $2.6 million.
Amazon is the second-most valuable company with a market value of $895 billion. Alphabet, the parent company of Google, is third at $863 billion.
***
Apple milestones
April 1976 Apple is founded by Steve Jobs, Steve Wozniak and Ronald Wayne.
June 1977 The Apple II computer is released.
December 1980 Apple goes public and its stock beings trading on the Nasdaq.
April 1983 Former PepsiCo executive John Sculley becomes Apple’s CEO after being recruited by Steve Jobs.
January 1984 Jobs unveils the Macintosh, the first mass-market personal computer to feature a mouse and a graphical interface on the display screen.
September 1985 Jobs leaves Apple’s board after company’s directors side with CEO John Sculley in a dispute between the two men.
June 1993 Longtime Apple employee Michael Spindler becomes CEO, replacing Sculley, who remains the company’s chairman.
August 1993 Apple releases the Newton, a touch-screen device that was supposed to work like a digital notepad.
October 1993 Sculley steps down as Apple’s chairman after a disappointing earnings report.
February 1996 Apple hires turnaround specialist Gil Amelio as its CEO after Spindler’s efforts to sell the company to Sun Microsystems or IBM unravel.
December 1996 Apple buys Next Software, a company started by Jobs, for about $400 million. Jobs agrees to return to Apple as an adviser.
August 1997 Apple announces it’s getting a $150 million infusion from archrival Microsoft to help keep the company afloat.
September 1997 Apple announces Jobs will serve as its interim CEO.
May 1998 Jobs unveils a new line of personal computers called the iMac.
January 2000 Apple drops the “interim” preface from Jobs’ CEO title.
May 2001 Apple opens its first retail stores in Virginia and California.
October 2001 Jobs unveils a digital music player called the iPod.
April 2003 Jobs unveils iTunes, a digital music store that initially only could be accessed on Apple devices. A version that worked on personal computers powered by Windows software came out six months later to broaden the market.
August 2004 Jobs discloses he had surgery for a rare form of pancreatic cancer.
October 2005 Tim Cook is promoted to chief operating officer.
January 2007 Jobs unveils the iPhone.
March 2008 Jobs announces an app store for the iPhone.
January 2009 Jobs takes a six-month leave of absence to tend to his health, temporarily turning the reins over to Cook.
January 2010 Jobs unveils a tablet computer called the iPad.
January 2011 Jobs takes an indefinite leave of absence, leaving Cook in charge once again.
August 2011 Jobs resigns as CEO and Cook succeeds him.
October 2011 Jobs dies.
March 2012 Apple announces it is restoring a quarterly dividend for the first time since 1995.
September 2014 Apple announces the Apple Watch, its first new product since Jobs’ death.
March 2015 Apple becomes one of the 30 companies comprising the Dow Jones Industrial Average.
June 2015 Apple launches its music-streaming service.
June 2017 Apple announces its first internet-connected speaker, the HomePod.
September 2017 Apple unveils its first $1,000 phone, the iPhone X, in celebration of the product line’s 10th anniversary.
August 2018 Apple becomes the first publicly traded company valued at $1 trillion.
Sunday, July 22, 2018
Bezos no. 2 / make that no. 1
[7/22/18] Just as Prime Day is kicking off, Amazon CEO Jeff Bezos on Monday reportedly became the richest man in modern history.
[1/9/18] Bezos made $6.1 billion in five trading days in 2018. Now worth more than Bill Gates was ever worth.
[7/27/17] Bezos passes Gates this morning to become the richest man in the world. Asking for ideas on philanthropy.
[7/24/17] For the 30 years FORBES has been tracking global wealth, only five people have ranked on our annual compendium of wealth as the richest person on the planet. At least one other person held the title, but so briefly (just two days), that he never appeared at that rank on FORBES’ annual list of World’s Billionaires.
Now, Amazon CEO Jeff Bezos is poised to join this exclusive single digit club, as Amazon stock continues to soar. The online retailer’s shares climbed 1.3% on Monday, adding $1.1 billion to Bezos’ net worth. Bezos is now a mere $2 billion from assuming the No. 1 spot on FORBES Real-Time Billionaires List, which would put him in the company of an exclusive group of billionaires who have held the title. Bezos has a net worth FORBES estimates at $88.2 billion as of the close of markets on Monday, while Microsoft founder Bill Gates holds the top spot on the list with a $90.1 billion fortune.
[3/30/17] Jeff Bezos has leapt past Amancio Ortega and Warren Buffett to become the world’s second-richest person.
Bezos, 53, added $1.5 billion to his fortune as Amazon.com Inc. rose $18.32 on Wednesday, the day after the e-commerce giant said it plans to buy Dubai-based online retailer Souq.com. Bezos has a net worth of $75.6 billion on the Bloomberg Billionaires Index, $700 million more than Berkshire Hathaway Inc.’s Buffett and $1.3 billion above Ortega, the founder of Inditex S.A. and Europe’s richest person.
Amazon’s founder has added $10.2 billion this year to his wealth and $7 billion since the global equities rally began following the election of Donald Trump as U.S. president on Nov. 8. The rise is the third biggest on the Bloomberg index in 2017, after Chinese parcel-delivery billionaire Wang Wei’s $18.4 billion gain and an $11.4 billion rise for Facebook Inc. founder Mark Zuckerberg.
Buffett, who’s added $1.7 billion in 2017, has shed $4.7 billion since his fortune peaked at $79.6 billion on March 1. Ortega is up $2.1 billion year-to-date. Bezos remains $10.4 billion behind Microsoft co-founder Bill Gates, the world’s richest person with $86 billion.
*** 5/15/17 ***
Jeff Bezos, founder and CEO of Amazon, is one of the most powerful figures in tech, with a net worth of roughly $82 billion.
Today, his "Everything Store" sells more than $136 billion worth of goods a year.
Here's how the former hedge funder got his start and became one of the world's richest people.
According to the Bloomberg Billionaires Index,
which tracks the net worth of the 500 richest people in the world ,
Bezos is now worth $150 billion. The staggering number is more than Bill
Gates was ever worth, even during the height of the dot-com boom,
Bloomberg reported.
After adjusting for inflation, Microsoft cofounder Bill Gates was worth $149 billion in 1999.
Bezos
and Gates have been duking it out to be the world's richest person for
the last few years, but it's worth noting that Gates has donated a
sizable part of his fortune to charity — primarily to the Bill and
Melinda Gates Foundation. Right now, Gates has a net worth of $95.5
billion, almost $50 billion less than Bezos.
[1/9/18] Bezos made $6.1 billion in five trading days in 2018. Now worth more than Bill Gates was ever worth.
[7/27/17] Bezos passes Gates this morning to become the richest man in the world. Asking for ideas on philanthropy.
[7/24/17] For the 30 years FORBES has been tracking global wealth, only five people have ranked on our annual compendium of wealth as the richest person on the planet. At least one other person held the title, but so briefly (just two days), that he never appeared at that rank on FORBES’ annual list of World’s Billionaires.
Now, Amazon CEO Jeff Bezos is poised to join this exclusive single digit club, as Amazon stock continues to soar. The online retailer’s shares climbed 1.3% on Monday, adding $1.1 billion to Bezos’ net worth. Bezos is now a mere $2 billion from assuming the No. 1 spot on FORBES Real-Time Billionaires List, which would put him in the company of an exclusive group of billionaires who have held the title. Bezos has a net worth FORBES estimates at $88.2 billion as of the close of markets on Monday, while Microsoft founder Bill Gates holds the top spot on the list with a $90.1 billion fortune.
[3/30/17] Jeff Bezos has leapt past Amancio Ortega and Warren Buffett to become the world’s second-richest person.
Bezos, 53, added $1.5 billion to his fortune as Amazon.com Inc. rose $18.32 on Wednesday, the day after the e-commerce giant said it plans to buy Dubai-based online retailer Souq.com. Bezos has a net worth of $75.6 billion on the Bloomberg Billionaires Index, $700 million more than Berkshire Hathaway Inc.’s Buffett and $1.3 billion above Ortega, the founder of Inditex S.A. and Europe’s richest person.
Amazon’s founder has added $10.2 billion this year to his wealth and $7 billion since the global equities rally began following the election of Donald Trump as U.S. president on Nov. 8. The rise is the third biggest on the Bloomberg index in 2017, after Chinese parcel-delivery billionaire Wang Wei’s $18.4 billion gain and an $11.4 billion rise for Facebook Inc. founder Mark Zuckerberg.
*** 5/15/17 ***
Jeff Bezos, founder and CEO of Amazon, is one of the most powerful figures in tech, with a net worth of roughly $82 billion.
Today, his "Everything Store" sells more than $136 billion worth of goods a year.
Here's how the former hedge funder got his start and became one of the world's richest people.
Wednesday, July 18, 2018
Peter Lynch
[7/18/18] Robert Abbott reviews One Up on Wall Street:
Introduction - The Power of Common Knowledge
chapter 1 - Great Investors are not born
chapter 2 - The Wall Street Oxymorons (professional investing)
chapter 3 - Speculating or Investing?
chapter 4 - The Mirror Test
chapter 5 - Is this a good market? (don't ask)
chapter 6 - Stalking the Ten-Bagger
chapter 7 - 6 Categories of Stocks
chapter 8 - Finding Companies
chapter 9 - Places to avoid
chapter 10 - It's all about earnings
chapter 11 - the two minute monologue
chapter 12 - getting the facts
chapter 13 - Ratios and Data
chapter 14 - Three phases of a company's life
[7/18/18] You have plenty of time
[6/18/15] 20 Golden Rules
[12/24/14] Stocks to avoid.
[12/24/14] The Perfect Stock
[5/19/14] Picking Stocks Like Peter Lynch (1:10:06 video from gurufocus)
[4/2/14] The Peter Lynch Portfolio 29 (only $79/year from gurufocus)
[6/7/09] Peter Lynch videos (John Templeton and Louis Rukeyser too)
[8/27/07] On market timing: ""I don't remember anybody predicting the market right more than once, and they predict a lot," Lynch said in a PBS interview several years ago. He also likened investing in stocks with a one- or two-year horizon to "betting on red or black at the casino," adding, "What the market's going to do in one or two years, you don't know. Time is on your side in the stock market."
Asked in that same PBS interview whether average investors should follow a "buy-and-hold" strategy, Lynch responded, "They should buy, hold and when the market goes down, add to it. Every time the market goes down 10%, you add to it, [and] you would have better returns than the average of 11%, if you believe in it, if it's money you're not worried about [in the short term]."<! forbes article via russ ->
[8/22/06] Since I am looking at this review of Beating the Street, I figured I'd collect some of the other links to Lynch sprinkled among this blog.
The Wit and Wisdom of Peter Lynch
The different kinds of companies
The Peter Lynch approach to 'Understandable' Stocks
Peters's 21 Principals
Fast grower or low p/e?
Don't invest like Peter Lynch
[9/6/06] Review of One Up on Wall Street
[9/26/06 from mia notes from 3/31/01] Perhaps the most important thing I've learned from Peter Lynch is (to paraphrase) if the earnings keeps growing, the price will eventually follow. ... I'm trying to look up the exact quote and the closest I could come is this paragraph from One Up On Wall Street, Chapter Ten entitled Earnings, Earnings, Earnings:
Here's some more from the Legg Mason Semi-Annual report (6/30/05). Stocks rise with earnings. "Stock prices are highly positive correlated (over 0.90) with the direction of profits, not their rate of group."]
[2/11/13] Here's another similar quote from One Up On Wall Street
"You can see the importance of earnings on any chart that has an earnings line running alongside the stock price. On chart after chart the two lines will move in tandem, or if the stock price strays away from the earnings line, sooner or later it will come back to the earnings." Peter Lynch - 'One Up On Wall Street”
On the other hand, Keith Wibel observes that "Over 10-year periods, the major determinant of stock-price returns isn't growth in corporate profits, but rather changes in price-earnings multiples. The bull market of the 1980s represented a period when multiples in the stock market doubled- then they doubled again in the 1990s. Though earnings of the underlying businesses climbed about 6% per year, stock prices appreciated nearly 14% annually."
Introduction - The Power of Common Knowledge
chapter 1 - Great Investors are not born
chapter 2 - The Wall Street Oxymorons (professional investing)
chapter 3 - Speculating or Investing?
chapter 4 - The Mirror Test
chapter 5 - Is this a good market? (don't ask)
chapter 6 - Stalking the Ten-Bagger
chapter 7 - 6 Categories of Stocks
chapter 8 - Finding Companies
chapter 9 - Places to avoid
chapter 10 - It's all about earnings
chapter 11 - the two minute monologue
chapter 12 - getting the facts
chapter 13 - Ratios and Data
chapter 14 - Three phases of a company's life
[7/18/18] You have plenty of time
[6/18/15] 20 Golden Rules
[12/24/14] Stocks to avoid.
[12/24/14] The Perfect Stock
[5/19/14] Picking Stocks Like Peter Lynch (1:10:06 video from gurufocus)
[4/2/14] The Peter Lynch Portfolio 29 (only $79/year from gurufocus)
[6/7/09] Peter Lynch videos (John Templeton and Louis Rukeyser too)
[8/27/07] On market timing: ""I don't remember anybody predicting the market right more than once, and they predict a lot," Lynch said in a PBS interview several years ago. He also likened investing in stocks with a one- or two-year horizon to "betting on red or black at the casino," adding, "What the market's going to do in one or two years, you don't know. Time is on your side in the stock market."
Asked in that same PBS interview whether average investors should follow a "buy-and-hold" strategy, Lynch responded, "They should buy, hold and when the market goes down, add to it. Every time the market goes down 10%, you add to it, [and] you would have better returns than the average of 11%, if you believe in it, if it's money you're not worried about [in the short term]."<! forbes article via russ ->
[8/22/06] Since I am looking at this review of Beating the Street, I figured I'd collect some of the other links to Lynch sprinkled among this blog.
The Wit and Wisdom of Peter Lynch
The different kinds of companies
The Peter Lynch approach to 'Understandable' Stocks
Peters's 21 Principals
Fast grower or low p/e?
Don't invest like Peter Lynch
[9/6/06] Review of One Up on Wall Street
[9/26/06 from mia notes from 3/31/01] Perhaps the most important thing I've learned from Peter Lynch is (to paraphrase) if the earnings keeps growing, the price will eventually follow. ... I'm trying to look up the exact quote and the closest I could come is this paragraph from One Up On Wall Street, Chapter Ten entitled Earnings, Earnings, Earnings:
... it always comes to down to earnings and assets. Especially earnings. Sometimes it takes years for the stock price to catch up to a company's value, and the down periods last so long that investors begin to doubt that will ever happen. But value always win out ...I'm now looking at the April 1999 Worth and Lynch is featured in an ad for Fidelity Aggressive Growth. Here's his quote,
Despite 9 recessions since WWII, the stock market's up 63-fold because earnings are up 54-fold. Earnings drive the market.[My question isn't why the correlation, but why the disparity? At first it seems way off because I thought 55-fold would be double of 54-fold. But actually 108-fold is. 63-fold is only 17% higher than 54-fold.]
Here's some more from the Legg Mason Semi-Annual report (6/30/05). Stocks rise with earnings. "Stock prices are highly positive correlated (over 0.90) with the direction of profits, not their rate of group."]
[2/11/13] Here's another similar quote from One Up On Wall Street
"You can see the importance of earnings on any chart that has an earnings line running alongside the stock price. On chart after chart the two lines will move in tandem, or if the stock price strays away from the earnings line, sooner or later it will come back to the earnings." Peter Lynch - 'One Up On Wall Street”
On the other hand, Keith Wibel observes that "Over 10-year periods, the major determinant of stock-price returns isn't growth in corporate profits, but rather changes in price-earnings multiples. The bull market of the 1980s represented a period when multiples in the stock market doubled- then they doubled again in the 1990s. Though earnings of the underlying businesses climbed about 6% per year, stock prices appreciated nearly 14% annually."
Thursday, February 15, 2018
a V bottom?
technician Urban Carmel of The Fat Pitch blog
recently undertook a study of 10% drops in the S&P back to 1980.
(In order to capture more cases, he didn't draw the line precisely at
10%, but stayed close to that mark.)
In all, there were 25 instances of an approximately 10% decline in the index. Of these, only 16% resulted in a V-bounce where the original low for the move was never revisited.
In the other 84% of the situations, the market returned to test its lows. So the odds are strong, on the historical record at least, that the S&P will creep back to the area of its February 8 closing low (2581) before the market can resume its climb to new all-time highs.
-- Richard Band, 2/15/18
Friday, February 09, 2018
bull and bear markets
Take the long view.
Markets typically go up and down, and you’re likely to experience several significant declines during a long investing career. But even bear markets—that is, periods when the market fell by more than 20%—historically have been relatively short.
The Schwab Center for Financial Research looked at both bull and bear markets, based on the S&P 500 Index, going back to 1966, and found that the average bear market lasted a little longer than a year (505 days). The longest of the bears was roughly two and a half years (915 days), and it was followed by a nearly five-year bull run.
Timing the market’s ups and downs is nearly impossible, but all investors would do well to ignore the noise and stay focused on their plans.
Friday, January 19, 2018
Gates to pay Nigeria's debt
Billionaire philanthropists Bill and Melinda Gates will pay off $76 million of Nigeria's debt.
It's part of a promise the Bill & Melinda Gates Foundation made to the African country in an effort to end polio. The payments, which will be made over the course of 20 years, are due to begin this year.
In 2014, Nigeria borrowed the money from Japan to fund its fight against the preventable disease, Quartz reports. The Gates Foundation had agreed to repay the loan if Nigeria met certain conditions, namely "achieving more than 80% vaccination coverage in at least one round each year in very high risk areas across 80% of the country's local government areas," according to an email from the foundation to Quartz.
Nigeria held up its end of the bargain, and no new cases of polio were reported in the country in 2017. That's a drastic change from 2012, when Nigeria had over half of all polio cases worldwide, according to Quartz.
In a recent blog post, Gates acknowledges the significant strides made towards wiping out the disease globally — 30 years ago, there were 350,000 cases of polio per year worldwide, while last year, that number dropped to just 21.
"The heroes who have made this progress possible are the millions of vaccinators who have gone door to door to immunize more than 2.5 billion children. Thanks to their work, 16 million people who would have been paralyzed are walking today," Gates writes.
Polio is "a crippling and potentially deadly infectious disease," which, after invading the nervous system, can cause paralysis. Among those paralyzed, two to 10 percent die.
The Gates Foundation spent $3 billion in 2017 to help stop the spread of the disease, and names polio eradication one of its "top priorities." The foundation says it has supported the Global Polio Eradication Initiative's efforts to wipe out the disease by contributing technical and financial resources to accelerate targeted vaccination campaigns, community mobilization and routine immunizations.
The Gates' donation is not out of character; in 2017, they gave $4.6 billion to their namesake organization. In addition to its work with polio, the foundation has also spent $1 billion in an effort to send over 20,000 kids to college and has committed millions more toward fighting Alzheimer's and providing resources to women in developing countries.
Thanks in part to his massive philanthropic efforts, Gates is no longer the richest person in the world, a title that he had held for much of the last decade. Jeff Bezos is currently the richest person, with a net worth of more than $108 billion, according to Forbes. Gates is currently worth $92 billion.
However, Bloomberg notes that Gates would have a net worth of $150 billion if he had not been so generous. While Bezos is not know for being particularly philanthropic as billionaires go, in January he announced a $33 million donation toward TheDream.Us, an organization that provides scholarships undocumented immigrants brought to the U.S. as children, known as "dreamers."
Gates also founded The Giving Pledge with Warren Buffett. Its billionaire signers have promised to give away at least half of their wealth.
"We have been blessed with good fortune beyond our wildest expectations, and we are profoundly grateful," Bill and Melinda wrote in their Giving Pledge letter, CNBC Make It previously reported. "But just as these gifts are great, so we feel a great responsibility to use them well."
Sunday, January 14, 2018
stock returns in the next 10 years
As 2017 dawned, few market experts had high hopes for stocks' returns over the next seven to 10 years; after all, the market had already staged a strong run stretching back to March 2009.
With stocks posting another stellar year last year--and with valuations that could hardly be described as cheap--most serious experts are even more circumspect in their long-range return expectations today.
True, economic fundamentals are fine: The economy is solid, unemployment remains low, and corporate earnings growth has been robust. But much of that good news is arguably already priced into stocks' valuations today.
At first blush, forecasting the market's returns, even on a long-term basis, might seem like folly. It's impossible to predict the future, right? But like it or not, market-return assumptions are an essential input for your financial plan. Without some reasonable expectation of what your portfolio will return, you can't know how much you'll need to save and for how long. You can't know whether saving for retirement should be your sole financial preoccupation or whether you can hit other goals, such as college funding, along the way.
To help you arrive at an educated guess of how much the market will contribute to the success of your plans, I've gathered return expectations from market experts both inside and outside of Morningstar. Note that the specifics of these return estimates vary a bit; some of these return expectations are inflation-adjusted while others are not. In addition, some of the experts cited below forecast returns for the next decade, while others employ slightly shorter time horizons. In any case, these return estimates are more intermediate-term than they are long. As such, they're the most relevant to investors whose time horizons are in that ballpark, or to new retirees who face sequence-of-return risk in the next decade.
John C. Bogle, founder of Vanguard Group
Highlights: 4% returns for stocks, 3% returns for bonds over the next decade (October 2017)
GMO
Highlights: -4.4% real (inflation-adjusted) returns for U.S. large caps over the next seven years; 2% real returns for emerging markets equities (October 2017).
Morningstar Investment Management
Highlights: 1.8% 10-year nominal returns for U.S. stocks; 2.5% 10-year nominal returns for U.S. bonds (Sept. 30, 2017).
Research AffiliatesHighlights: 0.3% real returns for U.S. large caps during the next 10 years; 0.8% real returns for the Barclays U.S. Aggregate Bond Index (Dec. 31, 2017).
Charles Schwab Investment AdvisoryHighlights: 6.7% expected nominal return from U.S. large-cap stocks from 2017-2026; 3.1% nominal returns from U.S. investment-grade bonds (August 2017)
Vanguard
Highlights: Nominal U.S. equity-market returns in the 3% to 5% range during the next decade; 5.5% to 7.5% returns for non-U.S. equities; 2% to 3% expected returns for global fixed-income markets (December 2017)