In each previous case, the market experienced a parabolic advance to the initial peak. A correction ensued, which was dismissed by the mainstream media, and investors alike, as just a "pause that refreshes." They were seemingly proved correct as the markets rebounded shortly thereafter and even set all-time highs. Investors, complacent in the belief that "this time was different" (1999 - a new paradigm, 2007 - Goldilocks economy), continued to hold out hopes the bull market was set to continue.
That was a mistake.
Also, in each period, once the monthly "sell signal" was triggered from a high level, the ensuing correction process took months to complete. This not only reset the market, but valuations as well. In both previous periods, reflexive rallies occurred, which eventually failed. While the 2008 plunge following the Lehman crisis was most similar to the current environment, there was a brief rally following the passage of TARP, which sucked investors in before the additional 22% decline in the first two months of 2009.
Most importantly, the market got very oversold early in both previous bear markets, and stayed that way for the entirety of the bear market. Currently, the market has only just now gotten to a similar oversold condition.
What all the indicators currently suggest is that, while the current correction has been swift and brutal, bear markets are not resolved in a single month.
This is going to take some time.
Bear Market Rally
Over the past couple of weeks, we have been talking about a potential reflexive bounce.
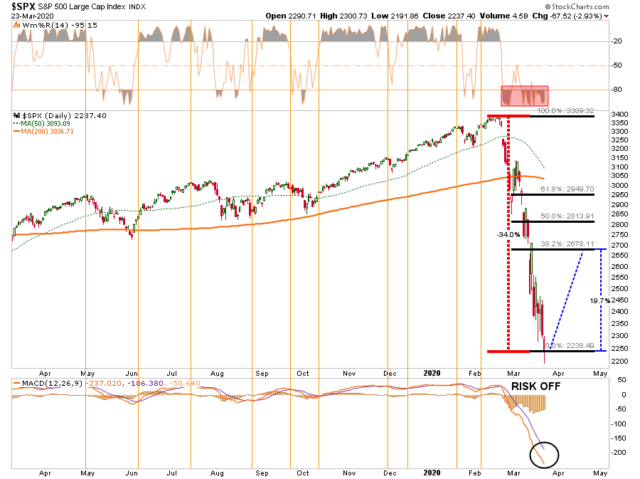
From a purely technical basis, the extreme downside extension, and potential selling exhaustion, has set the markets up for a fairly strong reflexive bounce. This is where fun with math comes in.
As shown in the chart below, after a 35% decline in the markets from the previous highs, a rally to the 38.2% Fibonacci retracement would encompass a 20% advance. Such an advance will "lure" investors back into the market, thinking the "bear market" is over.
This is what "bear market rallies" do and generally inflict the most pain possible on unwitting investors. The reasons for this are many, but primarily investors who were trapped in the recent decline will use the rally to "flee" the markets permanently.
More importantly, as noted above, "bear markets" are not resolved in a single month. Currently, there are too many investors trying to figure out where "the bottom" is, so they can "buy" it.
Bear markets do not end in optimism; they end in despair.
Looking back at 2008, numerous indicators suggest the "bear market" has only just begun. While this does NOT rule out a fairly strong reflexive rally, it suggests that any rally will ultimately fail as the bear market completes its cycle.
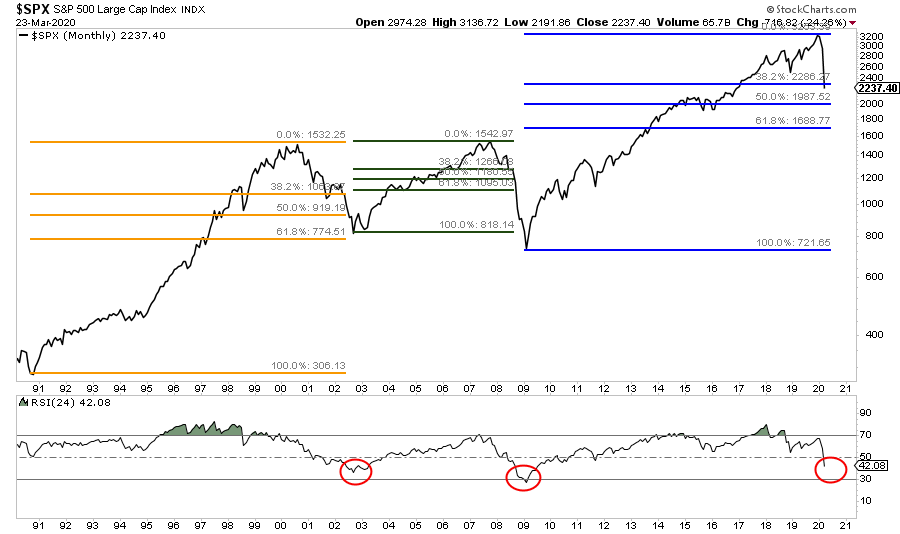
This can be seen more clearly in the monthly chart below, which looks at both previous bull and bear markets using a Fibonacci retracement. As shown, from the peak of both previous bull market "bubbles," the market reversed 61.8% of the advance during the "Dot.com" crash, and more than 100% of the advance during the "Financial Crisis."
Given the current bull market cycle was longer, more levered, and more extended than both previous bull markets, a 38.2% decline is unlikely to fulfill the requirements of this reversion. Our ultimate target of 1600-1800 on the S&P 500 remains confirmed by the quarterly chart below.
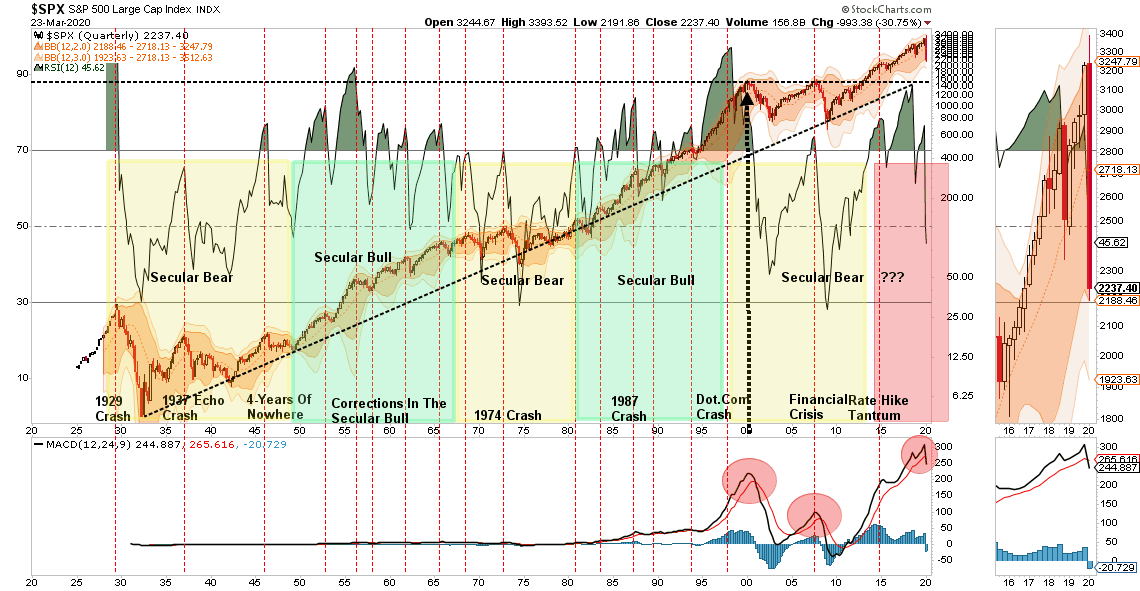
The current correction process has only just triggered a quarterly sell signal combined with a break from an extreme deviation of the long-term bull-trend back to the 1930s. Both previous bull market peaks coincide with the long-term bull trend at about 1600 on the S&P currently. Given all the stimulus being infused into the markets currently, we broaden our bear market bottom target to 1600-1800, as noted.
The technical signals, which do indeed lag short-term turns in the market, all confirm the "bear market" is only just awakening. While bullish reflexive rallies are very likely, and should be used to your advantage, this is a "traders" market for the time being.
In other words, the new mantra for the market, for the time being, will be to "Sell Rallies" rather than "Buy The Dip."
Yes, the market will rally, and likely substantially so. Just don't forget to take action, make changes, and get on the right side of the trade, before the "bear returns."
Let me conclude by reminding you of Bob Farrell's Rule #8 from our recent newsletter:
Bear markets have three stages - sharp down, reflexive rebound and a drawn-out fundamental downtrend
- Bear markets often START with a sharp and swift decline.
- After this decline, there is an oversold bounce that retraces a portion of that decline.
- The longer-term decline then continues, at a slower and more grinding pace, as the fundamentals deteriorate.
Bear markets often START with a sharp and swift decline.
After this decline, there is an oversold bounce that retraces a portion of that decline.
The longer-term decline then continues, at a slower and more grinding pace, as the fundamentals deteriorate.
Dow Theory also suggests that bear markets consist of three down legs with reflexive rebounds in between.
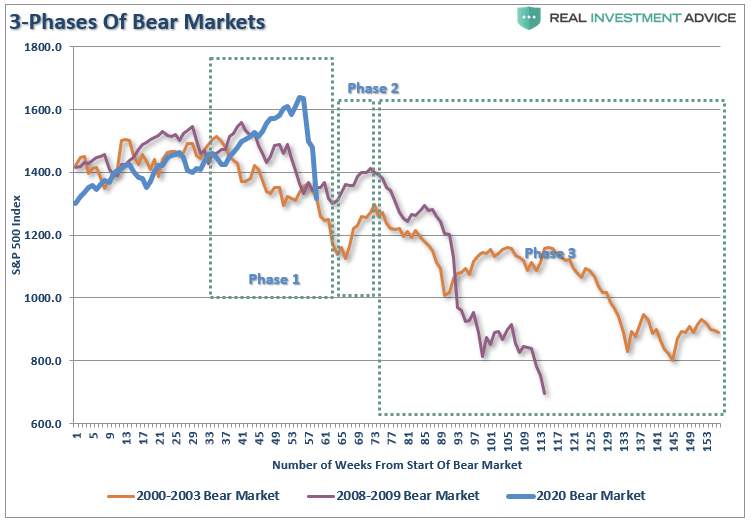
The chart above shows the stages of the last two primary cyclical bear markets versus today (the 2020 scale has been adjusted to match.)
As would be expected, the "Phase 1" selloff has been brutal.
That selloff sets up a "reflexive bounce." For many individuals, they will "feel like" they are "safe." This is how "bear market rallies" lure investors back in just before they are mauled again in "Phase 3."
Just like in 2000, and 2008, the media/Wall Street will be telling you to just "hold on." Unfortunately, by the time "Phase 3" was finished, there was no one wanting to "buy" anything.
-- Lance Roberts, Real Investment Advice
No comments:
Post a Comment