What drove performance … or lack thereof?
Remember, the S&P 500 is a cap-weighted index; and although it was about flat on the year, the average stock in the index did considerably worse—returning -3.8% according to Bespoke Investment Group (BIG), who took a look at what drove performance in 2015.Market cap: bigger was better. The 50 largest stocks at the beginning of 2015 were up an average of 1.5% by year-end; while the 50 smallest stocks were down 11.9%.
P/E: growth was better. Price/earnings ratios were a factor, too; although perhaps not as you might think. The four deciles of stocks with the lowest P/E ratios (i.e., the cheapest stocks) were all down at least 5%; while the four deciles of stocks with the highest (or no) P/Es (i.e., the most expensive stocks) were all at least flat or up on the year.
Dividends: none or lower was better. For income-oriented investors, note that the decile of stocks which started the year with the highest dividend yields were down 14.6%, while the stocks which pay no dividends at all were up 3.9%.
Momentum: 2014’s winners won again. The top six deciles of stocks which did the best in 2014 all averaged gains in 2015. The 50 stocks which did the worst in 2014 were down another 28% in 2015. Buying the losers of 2014 was about as painful as it gets.
FANG stocks ruled. The “fab four” stocks, now nicknamed FANG—for Facebook, Amazon, Netflix and Google (now called Alphabet)—were up over 60% on a cap-weighted basis. Excluding those four stocks, the S&P 500 was down 4.8% last year.
What’s happened following flat years?
Defining “flat” as the S&P 500 having a price-only (not dividend-adjusted) return between -2% and +2%, on a calendar year basis, the market has been flat in six years since the end of World War II. As you can see below, in each case, the market’s return the following year was positive by double-digits.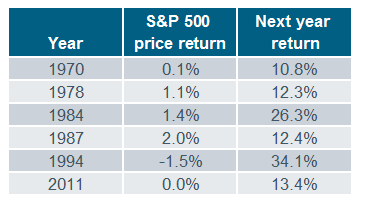
Source: FactSet.
The rub this year is that corporate earnings growth has been weak. In the highlighted “flat” years historically, each was followed by a strong earnings year. S&P 500 earnings are expected to lift out of negative territory this year; but if commodity price declines and dollar strength persist (the culprits to negative earnings), I would not place high bets on a strong year for US stocks.
No comments:
Post a Comment