Thursday, August 27, 2020

The 2020 Presidential election

Key takeaways

  • Expect short-term stock market volatility as the election heats up. But longer term, economic fundamentals are likely more important drivers for stocks than who wins the White House.
  • A Biden presidency could mean more economic stimulus than a Trump second term, but also higher taxes on businesses, higher income people, and capital gains.
  • While President Trump has focused on deregulation, a Biden administration would likely re-regulate certain industries. Among the possible targets: Fossil fuels, financial services, health care, and big tech.
  • Stock buybacks have been a significant source of returns for stock investors over the past decade. Democrats could move to limit them, while Republicans would likely support the status quo.

Elections matter to all of us, as citizens and as investors. US presidential election results drive policies that help shape our economy, the markets, and our lives. So it’s important to think about what the outcome could mean to your wallet.

And it's not just the presidential election that matters. Since much of a president's agenda requires congressional approval, the outcome of the congressional races is also key. Indeed, this time around, control of the Senate may be the key to enacting the next president's agenda.

The political outlook

At this early stage in the 2020 campaign, there is plenty of time for surprises to alter the course of history—particularly given the fact that this election is taking place in the midst of a global pandemic that has hit America hard. Still, it's worth considering a range of possible election outcomes. Here we look at 3 of the most likely scenarios—and the potential financial implications of each.

President Trump wins a second term and Congress remains split between a Democratic House and a Republican Senate

The Democrats sweep the White House and Congress

Former Vice President Joe Biden wins the presidency, but the Republicans hold the Senate

Scenario 1 is a continuation of the status quo. Scenario 2 likely brings re-regulation of some industries, higher taxes on corporations, upper-income individuals, and investors and more fiscal stimulus than in Scenario 1. In scenario 3, changes to tax and spending policy are likely muted by a GOP Senate.

Let's dig into some details.

The economy

No matter who is elected next year, the economy will likely still be recovering from recession and hardly at full throttle. So fiscal policy—federal taxes and spending—is likely to be key to economic growth.

"The 2020 multi-trillion-dollar fiscal spending package has been a major factor that's kept this economic environment from getting worse, along with the Fed's monetary stimulus," says Dirk Hofschire, Fidelity senior vice president of asset allocation. "But there is a risk, as we go forward, if the economy is not gaining significant traction and you still have large parts of the economy operating at limited capacity, that we're still going to need a lot of fiscal support."

Biden has proposed a combination of more federal spending and a redistribution of the tax burden from middle income taxpayers to corporations, high-income taxpayers, and investors. Hofschire says that's likely to mean more short-term fiscal stimulus under a Democratic presidency than a Republican one, particularly in a Democratic sweep.

"The tone of the Democratic fiscal plan would also be more likely to try to address growing income inequality and provide more spending and/or tax breaks geared to lower- and middle-income households," says Hofschire. "Because lower-income households tend to spend most of their income gains, this might be helpful consumer stimulus if the economic recovery is still struggling to regain traction."

But Hofschire speculates that a Biden tax plan, all other things being equal, would probably be "somewhat worse for the corporate profit outlook" than a Trump second term, and could fuel inflation longer term.

Taxes

During the Trump administration, federal tax rates on corporate and individual income and capital gains came down dramatically. The president has spoken of further cuts in a second term, but with a Democratic House that could be difficult to achieve. A more likely scenario is a continuation of current tax rates.

By contrast, Biden has proposed increasing the top tax rate for corporations to 28% from 21%, and for individuals to 39.6% from 37% while treating capital gains and dividends, now taxed at a top rate of 20%, as ordinary income.

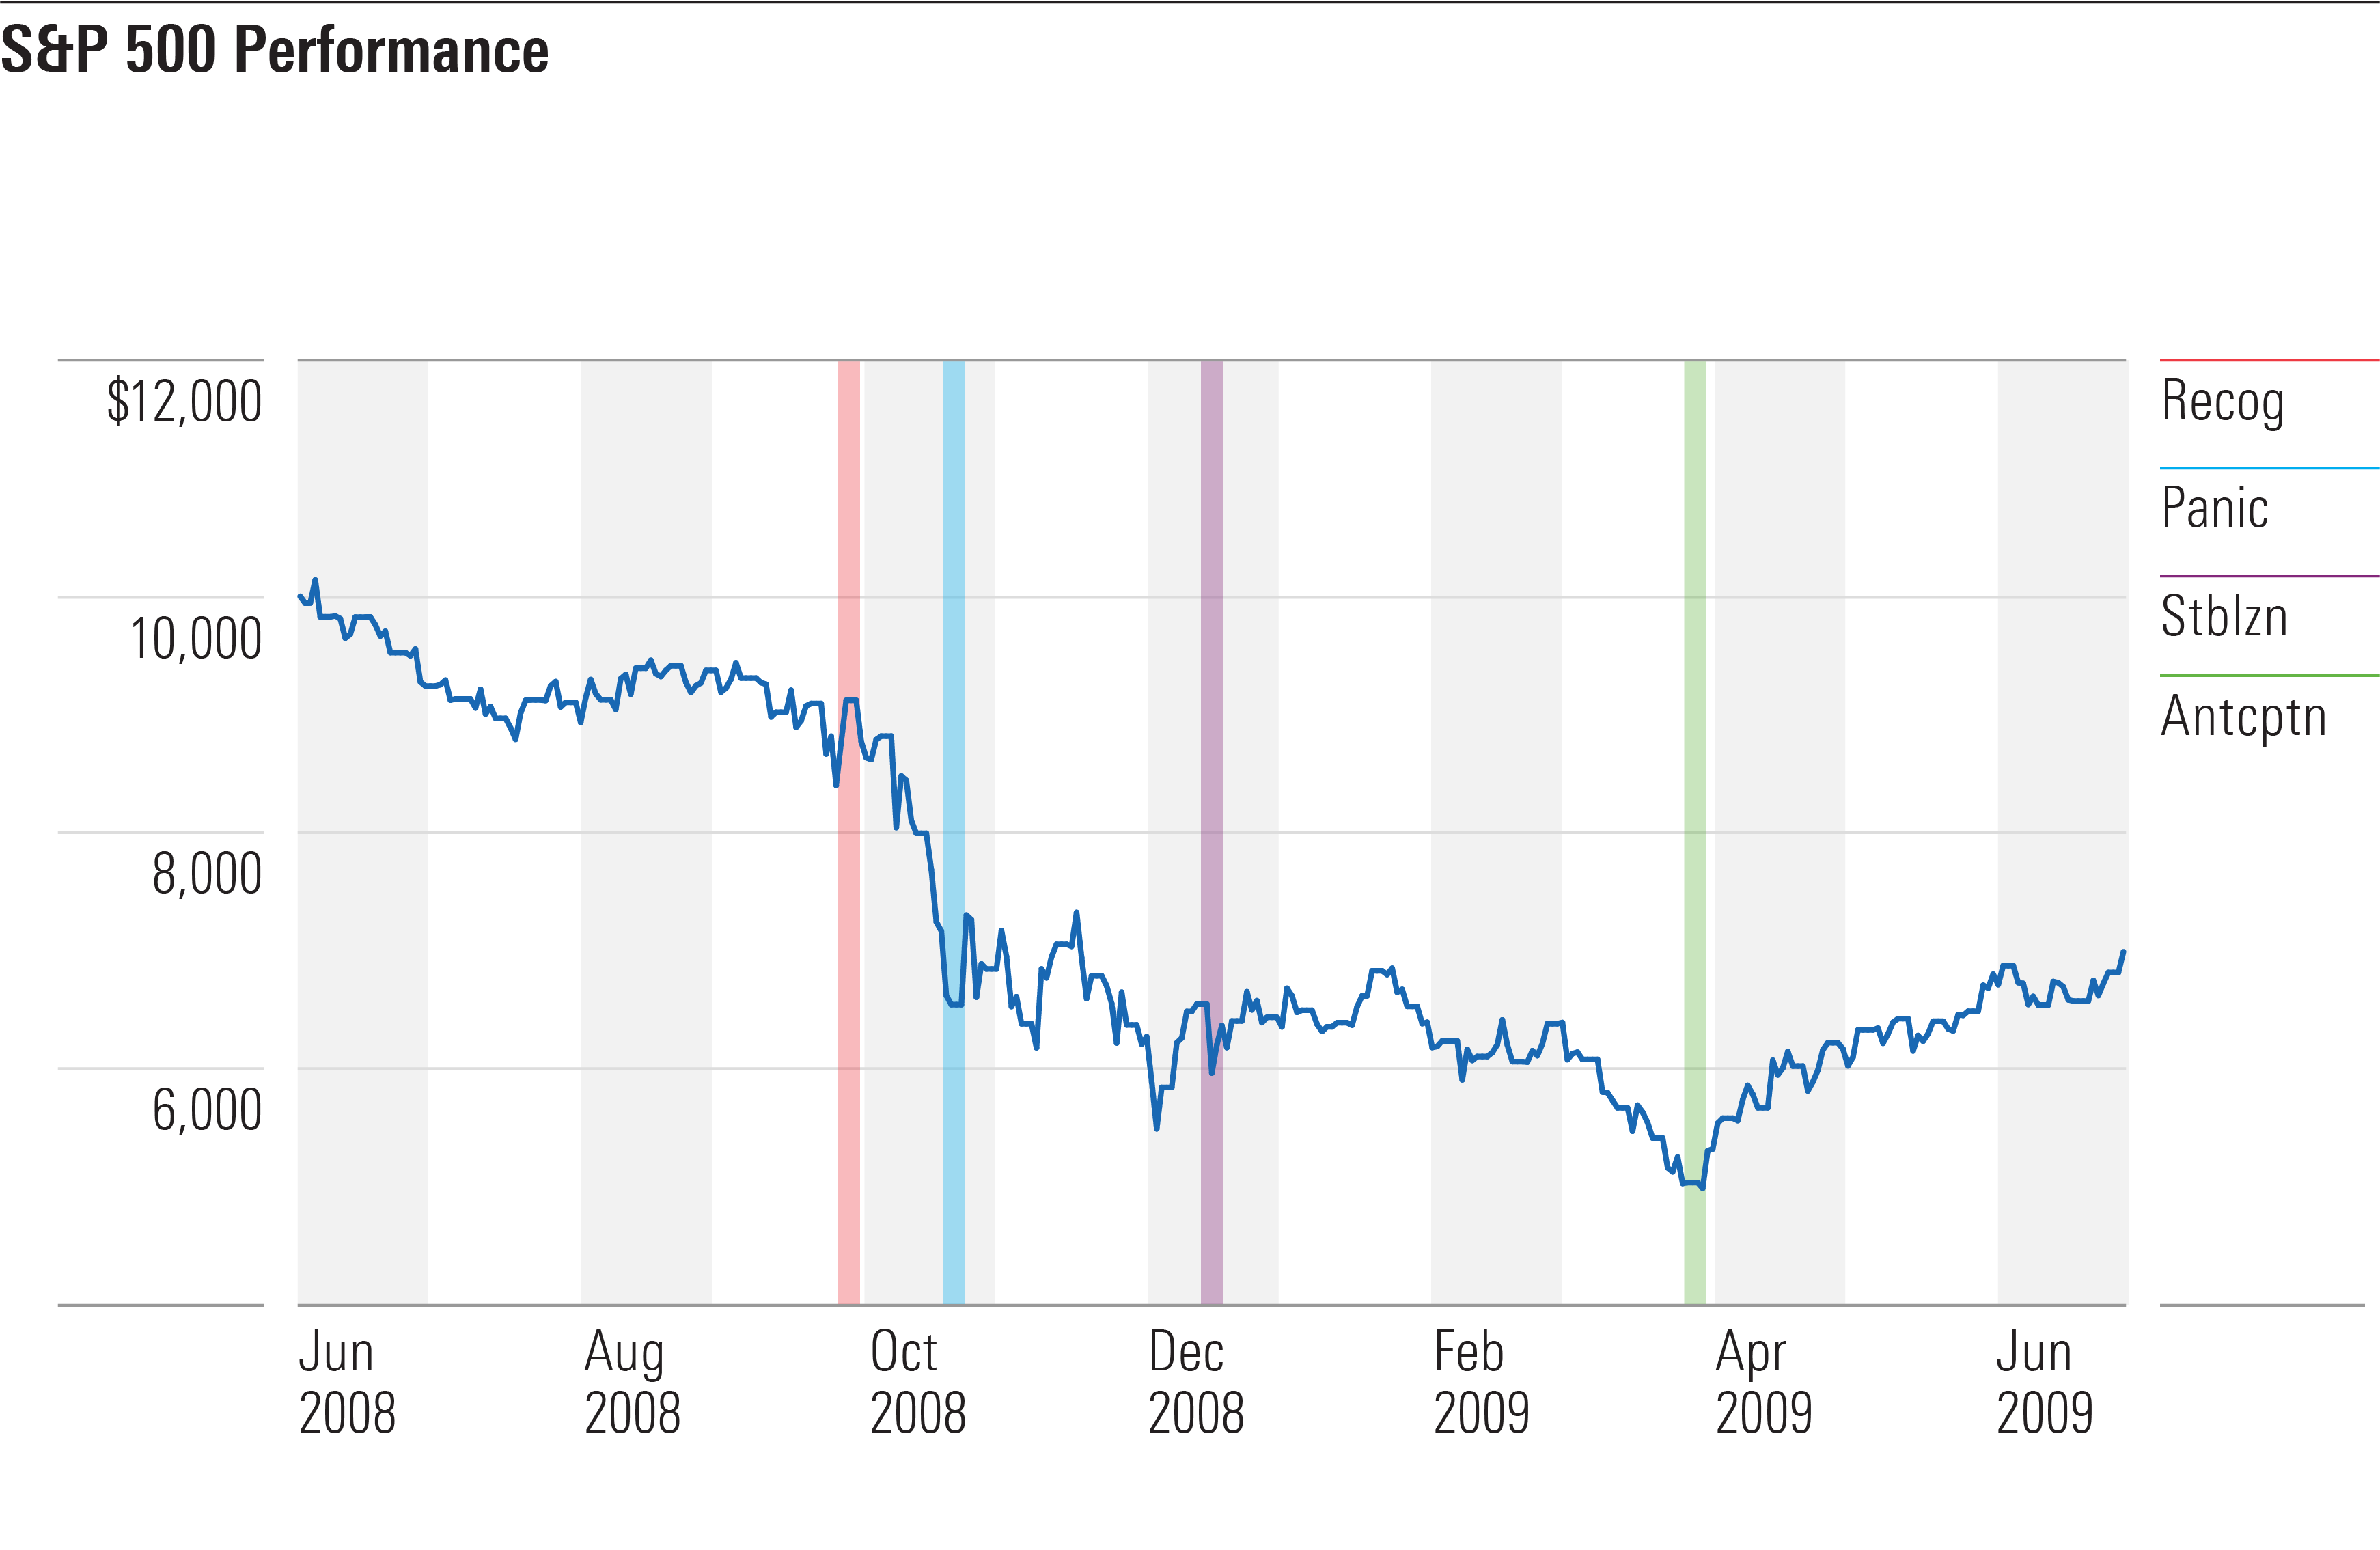
Increases in corporate tax rates would be a hit to earnings, which are one driver of stock prices (though not the only one). But historically, rising corporate and individual tax rates have not meant falling stock prices, Fidelity sector strategist and market historian Denise Chisholm notes. In the 13 previous instances of tax increases since 1950, the S&P 500, the stock index that tracks most of the major companies in the US, has shown higher average returns, and higher odds of an advance, in times when taxes are increasing, according to Chisholm's research.*

This holds true even when you drill down into key sectors of the S&P 500. "Economically sensitive sectors, like consumer discretionary, oddly have done better on average during years taxes increase. These counterintuitive odds suggest something else is going on—the market either discounts it in advance or the economy has received stimulus to offset it," says Chisholm.

Of course, if you are facing rising individual rates, you will want to consider strategies to minimize the impact on your bottom line. In addition to higher federal tax rates on income and investment gains, Fidelity's head of government relations and public policy Jim Febeo notes that the Biden campaign has talked about rethinking retirement savings tax incentives to promote more equality among different income levels. That could include reduction in the tax deduction for IRAs and 401(k)s, at least for upper-income people.

"With the fiscal situation where it is, all sources of potential revenue could be on the table," says Febeo.

It's always a good idea to take advantage of tax-preferred retirement savings opportunities, but that may be particularly true this year, given the potential focus on tax increases under a Democratic regime. Other strategies to consider if you are concerned about tax rates rising: taking some capital gains, or converting a portion of your traditional 401(k) or IRA savings to a Roth.

Stocks

For the overall stock market, there are pluses and minuses under all 3 election scenarios. With Biden, you'd likely have more fiscal stimulus but higher taxes on corporations and higher earners. That could include higher taxes on capital gains and disincentives for share buybacks, which have helped drive stock valuations higher in the US than other countries. With Trump, you'd likely see lower taxes but less stimulus and a more confrontational approach to US-China relations, which has unsettled markets in the past.

That makes it difficult to say which administration would be better for stocks. Says Jurrien Timmer, Fidelity's director of global macro: "It's my personal sense that the 2020 election will have less impact on the markets than some suggest. Ultimately, it's the long wave of economic fundamentals that drives the markets beyond any one election or any one party."

Still, in the near term, there would likely be different winners and losers under a Republican versus a Democratic regime, due to very different regulatory approaches.

The Trump administration ushered in a period of deregulation. One major winner was the oil and gas industry, which benefited from less stringent environmental regulations. "The Biden administration would likely go in the exact opposite direction, rolling many of those executive orders back and pushing for more clean energy," says Hofschire.

Other sectors that could come under heightened scrutiny in a Democratic administration include health care, financial services, and big tech. Says Timmer: "The 5 FANG stocks (Facebook, Amazon, Apple, Netflix, and Google) are 20% of the US stock market and are actually pulling the market higher right now. If they stop pulling, the market may stop going up, so that's yet another dimension to the puzzle."

Trade

On the trade front, the differences between the candidates may be more stylistic than substantive. "The tactics and tone of the US-China relationship might change," says Hofschire.

"Trump often takes a confrontational tone on social media. Biden is probably a much more conventional politician in regard to trade and foreign policy and would be more likely to build multilateral coalitions to try to influence China. However, there is a broad, bipartisan consensus to get tough on China, so any future policies are likely to continue to ramp up export controls, restrictions on investment, and other decoupling activities that deepen deglobalization pressures," Hofschire says. Among them: Incentives to bring back key links in the industrial supply chain to the US or at least diversify out of China.

Interest rates

Regardless of the election, interest rates are likely to stay low for a long time—so it's a good time for borrowers. Says Beau Coash, institutional portfolio manager in the fixed income division: "Given that the Fed is going to keep buying and supporting the bond market, it's hard to see interest rates going up anytime soon—probably not before we get back to a fully open economy."

If you are considering buying a home or refinancing, now is a great time to comparison shop. If you have a large portion of your portfolio in cash or low-yielding bonds, it might be a good time to meet with an advisor to discuss a long-term investment strategy with a combination of stocks for growth potential and high-quality bonds for wealth preservation.

Health care

Trump is opposed to the Affordable Care Act, the health care system put in place under the Obama administration. The Trump administration has brought a lawsuit against it all the way to the Supreme Court. Meanwhile, Biden has talked about enhancing the Affordable Care Act. So far, however, the details of their future plans are faint. So, we will need to wait and see how those plans take shape.

Biden has also spoken about extending Medicare eligibility to unemployed people 60 and over. If enacted, this may offer an interesting opportunity for people considering early retirement—or forced into it. Since health care costs are often a key reason people can't afford to retire early, Medicare could help solve that problem, and potentially enable people to postpone Social Security to their full retirement age or later, capturing higher monthly benefits.

What's ahead?

Given the pandemic, passions surrounding this election, and uncertainty about how and when the election results may be resolved, it would not be surprising if markets got volatile.

"There's a reasonable probability that we won't know the outcome of the election for at least a few days and maybe a few weeks after the election," says Hofschire. "The pandemic is creating huge logistical challenges for the electoral process, making in-person voting more difficult and causing delays in counting due to the high volume of mail-in ballots. Unfortunately, the highly polarized partisan atmosphere isn't making this situation any better. The futures markets are pricing in rising stock-market volatility moving into the elections, and I expect a messy or prolonged aftermath could extend that volatility into December and maybe even January."

*** [posted 8/30/20] ***

On the income tax side, Biden calls for raising the top individual income tax rate to 39.6% from 37%, and applying it to taxpayers with taxable income over $400,000, according to an analysis from the Tax Policy Center.

He’s also talking about an increase to payroll taxes. Biden would apply the 12.4% portion of the Social Security tax — which is normally shared by both the employee and employer — to earnings over $400,000, the Tax Policy Center found.

Currently, the Social Security tax is subject to a wage cap of $137,700 and is adjusted annually.

Finally, Biden would also boost rates on long-term capital gains and qualified dividends to 39.6% — the same top rate as ordinary income — for those with income over $1 million, according to theTax Foundation.

Currently, the long-term capital gains tax rate is 20% for single households with more than $441,451 in taxable income ($496,601 for married-filing-jointly) in 2020.

Wednesday, August 19, 2020

how is the market up?

Despite a global pandemic and double-digit unemployment in the United States, the S&P 500 stock index reached a new high yesterday.

We asked Andrew Ross Sorkin, a business columnist and founder of The Times’s DealBook newsletter, to help us understand how the market could be doing so well amid economic devastation.

As irrational as it might seem, here’s the way investors rationalize the bullish stock market to themselves (we’ll only find out whether they are right or wrong in the future):

1. The stock market is forward-looking: Investors are betting on what the world and the economy look like in 12 to 18 months from now, not what they look like today, tomorrow or this fall.

2. The big get bigger: Much of the stock market’s success has been the result of a run-up in value for a few big technology companies — including Apple, Amazon and Microsoft — that make up a large share of the index. And retailers like Walmart and Home Depot are growing in part because small businesses have closed, allowing the bigger companies to take even more market share.

3. Betting on a vaccine: Given the daily headlines about the potential for a vaccine, investors want to be invested in the market when the news comes that there is a genuine vaccine, on the assumption that it will send stocks even higher.

4. The only game in town: With the Federal Reserve planning to print money for the foreseeable future, investors don’t want to be in cash or bonds, which are steadily losing value. So where else can they put their money? The stock market has become a default.

5. Help from Washington: As dysfunctional as Congress has proved to be, investors are betting that Republicans and Democrats will find a way to keep plying the economy with stimulus. (Anecdotal stories suggest some Americans have even taken their $600 unemployment checks and invested them in the stock market.)

Of course, all of these rationalizations don’t take into account the possibility of a terrible second or third coronavirus wave, a delay in the discovery of a vaccine, a constitutional crisis come the election in November, runaway inflation, the prospect of higher taxes to pay for the stimulus, a more significant trade war with China, or the dozens of other risks that seem to be bubbling just below — and in some cases on — the surface.

In the meantime, happy trading!

-- New York Times, 8/19/20

Saturday, August 08, 2020

Black Turkeys

The circumstances of the 2020 market crash might be unique to the coronavirus pandemic, but they lead investors to wonder: Are such drops normal for equity markets, or is this different?

During the global financial crisis of 2007–09, some observers described the events that unfolded as a “black swan,” meaning a unique negative event that couldn’t be foreseen because nothing similar had happened before. But the data I’d seen from Ibbotson Associates, a firm that specialized in collecting historical market returns (and which Morningstar acquired in 2006 and merged into Morningstar Investment Management LLC in 2016), demonstrated a long history of market crashes. Some ended up being part of a larger financial crisis.

So, if these “black swan events” happen somewhat regularly—too frequently to render them true black swan events—then what are they? They’re more like “black turkeys,” according to Laurence B. Siegel, the first employee of Ibbotson Associates and now director of research for the CFA Institute Research Foundation. In a 2010 article for the Financial Analysts Journal, he described a black turkey as “an event that is everywhere in the data—it happens all the time—but to which one is willfully blind.”

Here, I take a look at past market declines to see how the coronavirus-caused market crisis compares.

Saturday, July 11, 2020

Shilling says...

Stocks could be poised for a big drop similar to the market’s decline during the Great Depression, according to financial analyst Gary Shilling.

In a CNBC interview, Shilling said the stock market could plunge between 30-40% over the next year as investors realize the economic recovery from the coronavirus recession could take longer than expected.

“I think we’ve got a second leg down and that’s very much reminiscent of what happened in the 1930s where people appreciate the depth of this recession and the disruption and how long it’s going to take to recover,” he said.

The S&P 500 plunged in February and early March as the coronavirus pandemic spread across the U.S., forcing businesses to shut down and lay off workers. Since mid-March, the index has rebounded roughly 40% as investors have become optimistic about the gradual reopening of the economy and policymakers have injected trillions of dollars of economic stimulus into the financial system.

Early economic data has bolstered the case for a V-shaped recovery, where the economy bounces back quickly from a steep downturn, yet some investors are still cautious as the number of coronaviruses cases in the U.S. continues to rise. Many Americans have missed out on the recent market rally, with record-high levels of cash sitting on the sidelines.

Shilling said the S&P 500′s comeback resembles its rebound in 1929, when stocks rallied after an initial crash. He warned history could repeat itself with the S&P 500 poised to tumble again like it did in the early 1930s after the severity of the Great Depression became clear.

“Stocks are [behaving] very much like that rebound in 1929 where there is absolute conviction that the virus will be under control and that massive monetary and fiscal stimuli will reinvigorate the economy,” he said.

Shilling, who is the author of several books including “The Age of Deleveraging: Investment Strategies for a Decade of Slow Growth and Deflation,” said the coronavirus pandemic will force consumers to remain more cautious about spending in the coming years.

“I think we’re going to see downward pressure on prices and that works to the advantage of Treasury bonds, which have been my favorite since 1981,” he said.

economy forecast - 2024

The Morningstar US Market Index has come thundering back since its late March nadir and is now down merely 7% year to date, even as the coronavirus pandemic persists. While many investors are wondering if the market is exhibiting irrational exuberance, we think the rebound has been broadly warranted, as we forecast a strong long-run recovery in the U.S. economy. We expect U.S. GDP to drop 5.1% in 2020 but surge back in 2021 and experience further catch-up growth in following years. By 2024, we think U.S. GDP will recover to just 1% below our expectations before the pandemic.

Is the stock market overvalued?

In recent columns, I have written extensively about the seeming ‘disconnect’ between the economic recovery (weak) and the stock market (strong). I won’t rehash those arguments here, but the overarching takeaway is that the stock market almost always moves well in advance of an economic and earnings recovery. If an economic recovery is expected to pick up steam twelve months from now, the stock market is likely to make its move today. In my view, that’s what we’re seeing right now.

An investor who accepts this argument may also wonder when the stock market is over-pricing a recovery. Or, simply put, when does the stock market become overvalued relative to future earnings and growth?

Many would say the stock market is already overvalued. On June 30, the forward P/E on the S&P 500 was 21.7x, which is considerably higher than the 10-year average of 15.1x. In fact, the S&P 500 has not traded at this high of a multiple since the late 1990’s, in the run-up to the tech bubble.1 Does this mean we’re in another period of “irrational exuberance”? I do not believe so, for four reasons.

1. The Fed Model Suggests Stocks Can Go Higher

Without getting too into-the-weeds, the Fed model is a way of valuing the stock market that compares the forward earnings yield (the inverse of the P/E ratio) of the stock market with the 10-year U.S. Treasury bond.

For illustrative purposes, let’s say the yield on the 10-year U.S. Treasury bond is 5%, and the forward earnings yield on the S&P 500 is 6%. In this case, an investor might do better with stocks, but may ultimately decide that the 1% difference is not worth the additional risk. If the yield on the 10-year Treasury is 1% and the earnings yield on the S&P 500 is 5%, investors usually choose stocks.

Today, the forward earnings yield of the S&P 500 is over 4%,3 and the 10-year U.S. Treasury bond closed the second quarter with a yield of 0.66%.4 When extra liquidity is looking for a place to go, and the choice is between stocks and bonds, stocks look far more attractive on a relative basis.

What’s more, all signs also point to the Federal Reserve repeating its post-2008 Financial Crisis playbook of leaving the federal funds rate near the zero bound for at least a few years. Historically, a forward P/E of 18x or 20x on the S&P 500 was viewed as fairly expensive, but at the same time, interest rates never been this low for this long. It was once outlandish to think the S&P 500 could trade at 25x forward earnings, but with the current interest rate outlook, it feels more possible than unlikely, in my view.

2. Tech Companies Make Money – Lots of It

The last time the S&P 500 traded over 20x forward earnings for a sustained period was 1997 – 1999, with the index topping out at around 25x.5 But looking back, we now know there were basically no earnings supporting tech’s astronomical rise. Today, tech companies are leading the way with sales growth, earnings growth, and arguably reshaping the modern economy as we know it in the process. The pandemic is accelerating these changes, in my view. Not the other way around.

3. The Very Worst of the Crisis is Behind Us

Cases of Covid-19 are rising, so there is no argument to say that the spread of the pandemic is improving. What has changed between April and today, however, is a better understanding of how to test, treat, and care for patients who become infected. There are also more hospital beds and medical supplies available to handle case surges.

From an economic standpoint, I agree that the longer this crisis drags on, the longer and more difficult the economic road to recovery will be. But at the end of the day, recessions end when economic growth begins – even if that growth is merely a trickle at first. In my view, the very worst of the economic crisis is behind us, and markets are looking ahead to what the economy could look like at this time next year.

4. You Really Cannot Fight the Fed and Fiscal Stimulus

The world has never seen this type of liquidity event before.

Drawing from lessons of past crises, the Federal Reserve and Congress acted quickly and decisively with extraordinary stimulus measures. This stimulus is not unique to the United States, either. Developed countries around the world and China are pulling the monetary and fiscal levers too, with total fiscal and monetary stimulus now amounting to approximately 28% of world GDP. When money supply growth exceeds nominal GDP growth, as is presently the case (by a long shot), this liquidity flows through the capital markets—pushing asset prices higher in the process, in my view.6

The stimulus may increase from here. In a congressional hearing at the end of June, Federal Reserve Chairman Jerome Powell and Treasury Secretary Steven Mnuchin both pledged to consider additional relief measures to support the economy as the pandemic drags on. It is difficult to make a bearish case when this ‘wall of liquidity’ looms in the backdrop.

Bottom Line for Investors

Considering the four reasons detailed above, in my view it is not outlandish to imagine a scenario where the S&P 500 trades at 23x, 25x, or even higher multiples. I am not declaring that the S&P 500 will trade at these valuation multiples – just that it could. If the S&P 500 were to trade at 25x 2021 earnings of, say, $160 a share, that would imply an S&P 500 at 4,000. In my view, this type of outcome is actually more possible today than it is unlikely.

-- Mitch on the Markets, 7/10/20

Sunday, July 05, 2020

Nifty Fifty deja vu?

If you look deeper under the hood of the stock market, you’ll see that there is a significant dichotomy between bytes stocks and atoms stocks. The atoms are losing to the bytes, badly. If you compare performance of the S&P 500 (SPY) traditional market-capitalization index – the one you see in the news – to its less-known cousin, the S&P 500 equal-weighted (RSP), you’ll see a significant disparity in performance.

In the market cap-weighted version, the top five stocks (all five are members of FANGAM gang – Facebook (NASDAQ:FB), Amazon (NASDAQ:AMZN), Netflix (NASDAQ:NFLX), Google (NASDAQ:GOOGL), Apple (NASDAQ:AAPL), Microsoft (NASDAQ:MSFT)) now represent 21% of the capitalization of the index (the last time this happened was 1999) and thus account for 21% of the returns. In RSP these stocks have a weight of 1% (they’re just 5 out of 500 stocks).

Just as any propaganda needs a certain germ of truth to grow from, so do bubbles. The FANGAM are incredible companies (germ of truth), and they function better in the virus-infested world (another germ of truth). But at the core, their existence is grounded in the world that is built of atoms, not bytes.

The Nifty Fifty stocks come to mind here. Those were the fifty stocks – the who’s who of the 1960s –that made America great (then): Coca Cola (NYSE:KO), Disney (NYSE:DIS), IBM (NYSE:IBM), Philip Morris (NYSE:PM), McDonald's (MCD), Procter & Gamble (PG) … the list goes on. Though today we look at some of them as has-beens, in the ’60s and ’70s the world was their oyster. Coke and McDonald's were spring chickens then, spreading the American health values of diabetes and cholesterol (okay, maybe I’m being too hard on them) across this awesome planet.

Although it was hard to imagine in the ’70s that any of these companies would not shine forever, they are a useful reminder that even great companies get disrupted. Avon (AVP), Kodak (KODK), Polaroid, GE (GE), Xerox (XRX) –all were Nifty Fifties, and all either went bankrupt or are heading towards irrelevancy.

In the 1960s and early 1970s these stocks were one-rule stock – and the rule was, buy! They were bought, and bought, and bought. They were great companies and paying attention to how much you paid for them was irrelevant.

Until.

If you bought and held Coke or McDonald's in 1972 (or any other Nifty Fifty stock), then you experienced a painful decade of no returns; in fact, at times you were down 50% or more. Coca Cola was as great a company in 1974 as it was in 1972, but the stock was down 50% from its high. Okay, Coca Cola was trading at 47 times earnings in 1972. But even a company like Procter & Gamble that was trading at “only” 32 times earnings in 1972 was down almost 50% in 1974 from its 1972 high. It took until the early 80s – a decade – until investors who bought Nifty Fifties at the top broke even – and this applies to almost all of them.

Another issue: If you held many Nifty Fifties for 20 years, from 1972 to 1992, they would have delivered a decent (10%-plus) return. This sounds great in theory; however, most people would have run out of patience after a decade of no or negative returns and thus not have been around for the fruits of the ’80s decade. In other words, shareholders who bought the stocks in 1970 were not the ones who benefitted from the returns in the late ’80s.

Today the Nifty FANGAM has turned into one-rule stocks – buy! (irrespective of price). If you did not own them over the last decade, your portfolio had an enormous headwind against it.

But what the Nifty Fifties showed us is that company greatness and past growth are not enough. Starting valuation – what you actually pay for the business –matters. The great companies will still be great when their stocks are down a bunch and they have a decade of no returns. Dividends aside, stock returns in the long run are not just driven by earnings growth but by what the price-to-earnings does as well. If price-to-earnings is high, it’s mean reverts – declines – chipping away at the return you receive from earnings growth.

Thursday, June 25, 2020

a low yield story

this is not the first time that a low interest rate environment has led to a reach for yield. In the 1820s (yes, you read that right), interest rates on UK government bonds (consols) dropped significantly, and staid investors who used to be happy to live off of the coupons paid by those bonds were forced to take on more risk than they otherwise would have liked to.

In 1825, investors were so willing to suspend disbelief that a Scottish con man named Gregor MacGregor was able to sell over a billion dollars worth of bonds of a completely fictional Latin American country he called "Poyais." I would highly recommend reading the whole story, as it is a fascinating look into investor psychology as well as an entertaining tale in and of itself. This era was characterised by speculative manias and a flood of cheap credit.

Sound familiar? It seems like the more things change, the more they stay the same.

irrational exuberance all over again?

Some have compared the recent retail investors’ enthusiasm to that of the dot-com bubble. “The key parallel between 2000 and today is that retail investors are seeing the stock market as a can’t miss opportunity,” said an unnamed source.

Whether this parallel holds or not, the data is pretty clear that the recent market rally is filled with some irrational exuberance. It may last a while, but if history is a guide, a happy ending is unlikely.

In his latest memo, Howard Marks (Trades, Portfolio) ended with the following words, which I find myself agreeing with:

“A bounce from the depressed levels of late March was warranted at some point, but it came surprisingly early and quickly went incredibly far. The S&P 500 closed last night at 3,113, down only 8% from an all-time high struck in trouble-free times. As such, it seems to me that the potential for further gains from things turning out better than expected or valuations continuing to expand doesn’t fully compensate for the risk of decline from events disappointing or multiples contracting.

In other words, the fundamental outlook may be positive on balance, but with listed security prices where they are, the odds aren’t in investors’ favor.”

Wednesday, June 17, 2020

Dave Portnoy and Robinhood traders

Amateur investors have been piling in money into different stocks and taking advantage of the market crash over recent weeks, but the billionaire investor Leon Cooperman has rebuked these gains and believes they will "end in tears."

Cooperman, who is the chairman and chief executive of Omega Advisors, told CNBC's "Half-Time Report" on Monday: "They are just doing stupid things, and in my opinion, this will end in tears."

The famed investor referred to the online trading platform Robinhood's surge in account openings, with more than 3 million new accounts created this year.

Robinhood has more than 13 million users, with an average user age of 31.

Cooperman said many new investors were replacing gambling and sports betting with trading, telling CNBC: "The gambling casinos are closed and the [Federal Reserve] is promising you free money for the next two years, so let them speculate."

He added: "Let them buy and trade. From my experience, this kind of stuff will end in tears."

Markets have largely rallied since touching lows on March 23, with many commentators highlighting that different day traders, also known as mom-and-pop traders, have contributed to this. Experts have been divided on whether to praise the surge in inexperienced investors or blame them for falsely inflating stock valuations.

A Monday note by Societe Generale said Robinhood traders displayed top-notch timing when they rushed to the market as it hit recent lows.

"For all the mocking of Robinhood investors, their timing back into the market looks impeccable, with a significant pick-up in holdings as equity markets bottomed in mid-March," Andrew Lapthorne of Societe Generale wrote.

But Peter Cecchini, the former global chief market strategist at Cantor Fitzgerald, said the actions of Dave Portnoy, the founder of Barstool Sports, a punter turned investor, were symptomatic of the dislocation between stock prices and economic reality.

"His attention-getting, wild style is emblematic of just how emotional and extreme equity markets are now," Cecchini said in a LinkedIn post on Friday. "It's both impulsive and compulsive. His behavior really just explains everything."

On Tuesday, Portnoy uploaded a video in which he said he "killed" the legendary investor Warren Buffett with his recent day-trading success.

Many amateur traders have been betting against the likes of Buffett, with the airline exchange-traded fund JETS seeing assets surge nearly 3,000% in three months, boosted by millennial day traders.

Day traders are piling into HertzJCPenney, and other bankrupt companies despite the overwhelming odds that shareholders will be wiped out during bankruptcy proceedings.

Before Hertz's bankruptcy filing on May 22, about 43,000 Robinhood accounts owned shares of Hertz. That number nearly doubled to 73,000 in the first week of June.

Minerd is bearish too

The Federal Reserve is buying junk bonds and corporate debt ETFs as part of its campaign to revive the American economy. Next on its shopping list: US stocks, as Scott Minerd, global chief investment officer at Guggenheim Partners, told CNN Business.

The S&P 500 has skyrocketed 40% since March 23, when the Fed announced its unprecedented experiment with junk bonds. That surge, coming in the face of the collapse of the real economy, drove up market valuations to dotcom-bubble levels.

It's a troubling precedent that the Federal Reserve is going to sit there and continue to fund these zombie companies that don't deserve to exist."

But Minerd thinks a reckoning is coming, and soon. He expects the S&P 500 will retest its March 23 low of 2,237.40 over the next month, potentially crumbling to as low as 1,600. That would mark a 49% collapse from where the index traded Tuesday during a strong rally.

"There's a point where the Federal Reserve is going to have to pull out a bazooka," Minerd said in an interview. "And I think the option of buying stocks on the part of the Fed is on the table."

Should a stock market collapse happen, it would erode confidence among consumers, small businesses and CEOs alike. And it would make it harder for companies to borrow the money they need to survive because of the strong link between stock prices and corporate credit spreads.

"The Fed has basically told us they don't have a stomach for this," said Minerd. He warned his clients back in February -- when US stocks were rising to ever greater heights -- that there were "red flags" in financial markets.

"This will eventually end badly. I have never in my career seen anything as crazy as what's going on right now," he wrote on February 13.

This isn't the first time Minerd has warned of a brewing storm. In August 2007, he said the credit squeeze at the time could morph into a recession. Stocks hit record highs that fall, before beginning an historic collapse as the Great Recession began.

Grantham is bearish

Jeremy Grantham, the longtime investor who called the financial crisis, told CNBC’s “Closing Bell”  that this U.S. stock market rebound amid the coronavirus may be the fourth major market bubble he’s seen in his lifetime. He advises investors to take their U.S. exposure to zero. “The U.S. is simply now playing with fire. You might make a lot of money in a really short time but recognize we are skating on very thin ice,” said Grantham.

***

Investor Jeremy Grantham is growing more and more sure that the U.S. stock market’s rebound amid the coronavirus pandemic is forming a bubble that is ignoring reality and will end up hurting many people.

 “My confidence is rising quite rapidly that this is the fourth ‘Real McCoys’ bubble of my investment career,” Grantham, co-founder of GMO, told CNBC’s Wilfred Frost on Wednesday in an interview which aired on “Closing Bell.” “The great bubbles can go on for a long time and inflict a lot of pain.”

The previous three bubbles Grantham referred to were Japan in 1989, the tech bubble in 2000 and the housing crisis of 2008.

Tuesday, May 12, 2020

most expensive in 20 years?

The U.S. stock market stands 4% higher today compared to a year ago, despite the death and destruction unleashed by the coronavirus pandemic.

Although more than 80,000 Americans have died and over 33 million have lost jobs, Wall Street has swiftly recovered from the initial shock delivered by the health crisis. The S&P 500 has spiked 31% since the March 23 lows.

The rapid recovery on Wall Street has lifted market valuations into ultra-rich territory. The S&P 500 now trades at 22.5 times projected earnings, according to Refinitiv, the most expensive valuation since October 2000 during the bursting of the dot-com bubble.

Some experts are warning this euphoria could set the stage for a major setback in the stock market given the steep challenges that still exist.

Even Goldman Sachs, which is bullish on stocks in the long run, is warning clients to brace for a bumpy ride this summer. The investment bank expects the S&P 500 will plunge back to 2,400 over the next three months, representing a potential decline of 18%.

Sunday, April 12, 2020

a new bull market already?

As you know, the Dow exited its bear market on March 26th, when it closed up by more than 20% from its lowest close. Currently, the Dow is now up 26.04% from their lowest close.

The S&P finally followed suit and exited their bear market yesterday when it surged past 2,684.88, before finally closing at 2,749.98, up 22.91% from their lowest close.

The Nasdaq is not that far behind. They are now up 17.93% from their lowest close. But a close at or above 8,232.80 sees them exiting their bear market. And that's only another 1.75% away.

We also saw crude oil soar by more than 10% ahead of today's emergency OPEC meeting where Saudi Arabia and Russia are expected to cut production.

But the biggest piece of good news came from the fight against the coronavirus. It appears all of the social distancing measures are indeed bending the curve, and that we'll dodge the worst case scenario.

Gone are the predictions for up to 240,000 deaths. Now predictions are for 60,000 by early August. Still a tragedy. But I wouldn't be surprised to see that number lowered again as time goes by.

While we'll likely all be stuck inside for the rest of the month, planning is underway for how to reopen the economy. Will it be a partial open with certain regions going first and others to follow, or will it all open at once?

Nobody yet knows what that will look like. But it's a conversation we could've only dreamed about a few short weeks ago. Now we're planning for its actual implementation in the very near future.

In the meantime, we still have to take care of our businesses and employees that are temporarily out of work.

To date, there's been $100 billion in small business loans already processed, which is estimated to have saved as many as 9.5 million jobs.

But that money is going fast. And the original $350 billion is expected to be tapped out within the next few days/weeks.

Because of this, congress is expected to pass an additional $250 billion in small business loans this week to further help business and workers stay afloat for the next month or two until the economy reopens.

And once it does, this lifeline will allow everybody to hit the ground running.

But remember, the market is forward looking. It doesn't wait for the all clear sign before moving up. It does so ahead of time.

So now's the time to start building your portfolio of dream stocks for the inevitable bull market to follow.

-- Kevin Matras, Profit from the Pros, 4/9/20

Saturday, April 04, 2020

how long with this bear market last?

Generally speaking, there are three types of bear markets: structural, cyclical, and event-driven. Every bear market has a unique set of drivers, of course, but throughout history most of them fall into one of these three categories:
  • Structural – These are bear markets like the 2008-2009 downturn, which are driven by financial bubbles, too much leverage, credit market dislocations, and other structural imbalances.
  • Cyclical – Cyclical bear markets happen more as a function of the business cycle, when growth leads to inflation, interest rates go up too fast, the yield curve flattens or inverts, loan activity declines, demand wanes, etc.
  • Event-Driven – These bear markets are triggered by an exogenous event, like an energy crisis, political instability, war, or in the case of the current bear market, a global pandemic.
Looking back at data going back to the 1800’s, here’s what we know about the relative magnitude and duration of each category of bear market:


It makes sense why structural bear markets tend to be the most severe – they result from systemic issues in the financial system and capital markets, which can take a lot of time and pain (in the form of bankruptcies, restructurings, etc.) to fix.

Cyclical bear markets are next, and generally require the business cycle to run its course, for interest rates to fall, maybe some monetary and fiscal stimulus to stoke demand. Cyclical bear markets are bad, but have tended to resolve themselves with time and adequate policy responses.

Last on the list are ‘event-driven’ bear markets, which throughout history have tended to be shorter, less severe on the downside and take less time needed to recover than ‘structural’ or ‘cyclical’ bear markets. This makes sense: in many cases, the global/US economy is in decent or good shape before an exogenous event takes place, meaning that it does not take quite as long for the economy to recover once the impact of the ‘event’ fades.

In the current environment, for example, millions of jobs were lost very early in the crisis as businesses made fast and severe adjustments to cope with shutdowns and restrictions. But once these restrictions are removed, the lost jobs could return fairly quickly – and arguably more quickly than if this were a structural or cyclical recession, in my view.

To be fair, I think it’s important to acknowledge that there has not been an event-driven bear market in history that was triggered by a virus/disease outbreak. I think it’s important to hold out the possibility that this event-driven bear could morph into a structural bear if the crisis is not contained by, say, summer. In the meantime, however, I think the sheer size and speed of fiscal ($2 trillion legislation) and monetary (virtually infinite liquidity) stimulus should help keep this bear market in the event-driven category for a few months.

In China, new Covid-19 cases fell sharply by mid-March, with the first day of no new cases reported on March 19 – about two and a half months into the outbreak. As I write this, more than 98% of China’s major industrial companies have resumed operations, with 90% of workers back on the job. Shopping malls in Wuhan, where Covid-19 first appeared, opened for business this week after being shut completely for two months.3 If, in the West, we manage to contain the crisis and the ‘curves all flatten’ by summer, we could tiptoe back to normal economic activity perhaps by late summer. Time will tell.

There is no way to know when this bear market will bottom. But what I can tell you, from a long reading of history, is that the bear market will likely come to end as the news remains bad and even gets worse. In other words, I think on day 1 of the new bull market, we will still be reading about job losses, lost profits, and bleak statistics about the pandemic. That’s what makes it impossible to predict.

Mitch on the Markets, 4/2/20

Monday, March 30, 2020

Another Great Depression?

Due to some dramatic elements, this period has been compared by many analysts to the Great Depression of the 1930s.

There are some similarities, including a scenario where a debt supercycle reaches its later stages.

However, there are also several key differences between now and then. Some better, some worse, but mainly just different.

Friday, March 27, 2020

40 years and 40 days

I Became a Disciplined Investor Over 40 Years. The Virus Broke Me in 40 Days.

I’ve survived — and even prospered through — four stock-market crashes. But nothing prepared me for this.

It’s Thursday morning, March 19 — four weeks into the coronavirus crash of 2020. The Dow Jones industrial average has opened down another 700 points, after plunging below 20,000 a day before. It’s down 30 percent in a month, the steepest drop ever, even worse than during the Great Depression.

The fall has been nauseating. Yet I know this is a time to be buying stocks based on rules I’ve developed over decades of investing. But in order to do that, I have to log on to my brokerage account. When I do, the first number I’ll see is the current market value of my portfolio.

Isolated at a farmhouse in rural New York, surrounded by wilderness, I haven’t looked in days. I don’t want to look now.

I decide I’d better check the weather forecast instead. And then there’s email to catch up on. An hour later, I’ve done nothing.

I’m paralyzed.

I’ve owned stocks for nearly 40 years. I’ve lived through, survived and even prospered through four crashes.

So I should be prepared. Yet, looking back at the last few weeks, I recognize that I’ve violated most of my time-tested rules. Whipsawed between optimism and despair as the bad news mounted and my daily life was upended, I’ve let emotions influence my decisions. I’m doing it again this morning.

I first bought a stock mutual fund during the summer of 1982, as soon as I’d saved enough money to invest. My father, a Cadillac-driving sales manager for NBC’s local TV and radio affiliates, had been an avid believer in the stock market, and he’d drummed his faith into me.

It turned out that 1982 was a great year to buy, not that I realized it at the time. For years, I enjoyed the positive reinforcement of a steadily rising market. I loved looking up my mutual fund in the newspaper stock tables. Over the next five years the market tripled.

On Oct. 19, 1987, I was visiting my brother, who was spending a semester in France. When I left my hotel in Strasbourg early the next morning, I noticed the front pages on newsstands carried banner headlines reporting the Dow had dropped “23.” I wondered why the American market was front-page news in France. I looked more closely and saw the 23 preceded a percentage symbol. The Dow had dropped an unfathomable 508 points in one day. On a percentage basis, it was the stock market’s worst day ever.

I felt a powerful urge to salvage what was left of my modest savings by selling. But I was far away and had no choice but to hold.

Once I was back in the United States, the market seemed to stabilize. But volatility soon returned. In one of those downdrafts, I panicked and sold my entire fund.

By September 1989, the market had recovered all its losses. I watched from the sidelines, waiting in vain for a good time to get back in.

I vowed to never again trade in a panic. I made a rule — never sell on a down day — and a corollary: Never buy on an up day.

That served me well over the next decade’s record bull market, fueled by the tech boom. Times were even headier than during the 1980s. I often overheard personal trainers at the gym boasting about their favorite tech stocks.

The notion of diversification was largely unknown to me. In early 2000, when the tech bubble burst and the next crash came, I was fully invested and stayed that way. I watched as the value of my investments shriveled. I stopped looking at stock tables, which at least provided some psychological comfort. I dropped my monthly paper statements into the trash unopened.

But at least I adhered to my 1987 principle: I did not sell.

In the wake of the two-year bear market, I refined my strategy. I figured that if I bought every time the market average declined by 10 percent from its previous high — the standard definition of a correction — and then bought some more after each subsequent decline of 10 percent, then I’d never be buying at the top of the cycle.

I didn’t think of this as market timing, since I made no prediction where the market was headed. My strategy was a variation of the now-widespread practice of portfolio rebalancing — selling some asset classes and buying others to maintain a steady allocation.

I put this system into practice during the 2008 financial crisis. I recall shocked reactions that October when — with the market plunging and others boasting that they’d had the foresight to get out — I said I was buying.

My timing was hardly perfect. The market fell by 10 percent on five occasions — so I had plenty of opportunities to add to my stock positions. The last came in March 2009. In hindsight, the first of those 10 percent declines was a foolish time to have been buying, given that the market went down another 40 percent. But I reaped the gains even on those early purchases during the record-setting bull market that ended this month. Back in 2009, I didn’t have to worry about getting back into the market. I was already there.

What’s another virus scare?

There have been only five 10 percent corrections since then, and each was a buying opportunity for me. None was followed by a second 10 percent decline. The last of these corrections came at the end of 2018. As cash built up in my account, I wondered when, if ever, I’d get another such opportunity. I grew impatient. On Feb. 19, the S&P 500 closed at a record high. No one seemed to see a bear market or recession on the horizon, even as stock multiples teetered at record highs and a strange virus began to spread.

Until a week later.

Stocks fell, slowly at first, then gaining steam. By Feb. 25 the S&P 500 had dropped 7.6 percent from its peak.

From a financial standpoint, I wasn’t worried about the virus. Infections were leveling off in China. There were a few cases in the United States, most in a single nursing home in Washington State. Everyone was saying we had better medical care, better air quality and more effective means to prevent its spread than China. As an investor, I’d lived through many virus scares — SARS, MERS, swine flu, Ebola — and their ravages had no discernible impact on American stocks. Even the devastating AIDS epidemic had little effect on the broader economy or booming market.

So I bought stock (a broad-based index fund) on Feb. 25, jumping the gun on my own 10 percent buying target. My pent-up eagerness and optimism overwhelmed my disciplined strategy. I didn’t make a conscious decision to violate it. I didn’t even think about it in my haste to take advantage of what I assumed would be a fleeting opportunity.

Stocks dropped a little more the next day. Then, on Feb. 27, the S&P plunged nearly 5 percent. Now the market was officially in a correction, its fastest ever, down 12 percent from the peak the prior week. The coronavirus had spread globally, including to the United States.

I realized I should have waited. I felt foolish and guilty for violating my rules. I vowed not to do it again.

The biggest drop since Black Monday

But how smart I felt the next Monday. The S&P soared nearly 5 percent, amid rumors the Federal Reserve was about to cut interest rates.

The high was short-lived. By the end of the week, the S&P had erased Monday’s gains. By now I was worried, too, but I’m not an infectious disease expert. I figured stocks had priced in the risks. What I did know was that they were now deep into a correction, and so I bought more.

My buying may have been premature the first time, but now I was back on track, sticking to my playbook. At a time of soaring uncertainty on so many fronts, I felt like I was taking charge of my destiny.

That was the last time that buying stocks felt good, like I was pouncing on a fleeting opportunity. It soon became a source of profound anxiety.

Over the first weekend in March, headlines were all about the explosive spread of the virus in Italy. Photos of deserted piazzas drove home the gravity of the situation. What had seemed a distant threat now seemed close to home.

If that weren’t bad enough, Russia and Saudi Arabia decided to launch an oil price war just as demand was collapsing. Oil prices plummeted, dragging down the entire energy sector.

I expected it would be a bad Monday in the markets, but it was even worse. Circuit breakers kicked in to halt chaotic trading. The S&P closed down that day by 7 percent, the biggest drop since Black Monday in 1987.

I summoned the nerve to look at my brokerage account. I was shocked: The stock portion was down far more than the broad U.S. market averages. My international stock index fund was down 20 percent from its February peak, and the emerging markets fund had lost a quarter of its value.

I thought back to my experience 33 years earlier, when I’d panicked at the headlines in Strasbourg. I tried to remind myself that short-term volatility aside, the long-term trajectory of the market has always been up. When the market goes down, it’s time to think about buying more stocks — a time that came much sooner than I’d hoped or expected.

On Thursday, March 12, after President Trump banned most air travel between the United States and continental Europe, and after economies around the world started shutting down, the carnage in the stock market was even worse than Monday. The S&P dropped 10 percent, leaving it 27 percent below its peak a few weeks earlier.

According to my own rules, it was time to buy.

I hardly noticed. I was busy canceling a planned vacation the next week to the Virgin Islands. I began pondering the prospect of my own isolation, something that even a few days earlier had seemed unthinkable.

Worse, a friend in Spain, a healthy 40-year-old I had just visited in November, had fallen seriously ill with the virus. He was in a coma in a Madrid hospital.

I was worried about the spread of the disease. I wasn’t thinking about the stock market or my rapidly declining net worth.

Record-setting volatility

My strategy for trading isn’t meant to be rigid, only to be rational. It doesn’t matter if I miss a percentage point or two here or there, or if my timing is a little off, or if more important matters take precedence — as they have now. Two more friends told me they have the virus. Still, during the following days, when I pondered the rush of events during some long walks along a country road, I recognized I was running out of excuses for inaction. I knew I should be buying again, with the S&P remaining well below my 20 percent target. But trading was more volatile than anything I’d ever witnessed. The S&P logged a record seven straight days of swings of 4 percent or more.

That Friday, March 13, stock markets staged a late-afternoon rally as Mr. Trump promised new measures to contain the virus and shore up the economy. The S&P 500 closed almost exactly 20 percent below its peak. Still I did nothing.

It was just as well. On Monday, the market collapsed, erasing all of Friday’s gains. The Dow fell below the 20,000 milestone for the first time in three years. Markets were now down 30 percent. It was time for me to buy.

Having skipped the 20 percent buying “opportunity,” I knew it was time to step up. But I wasn’t going to do it on a day the markets had been in free fall. And in any event, I was back to avoiding my brokerage’s website.

The next day the stock market jumped higher. I felt a strong temptation to buy, gripped by the notion that the worst might be over. I worried I was missing the bottom by again failing to act on my strategy. But the 30 percent window had closed, and I reminded myself that my rule is never to buy on an up day.

The next day brought what seemed like good news: New infections in China had dropped to zero. Even so, that morning markets sank, again triggering my 30 percent buying target. This time I was determined to act.

And yet I dawdled. I checked the news, the weather, my emails. I told myself this was absurd. Whether I looked or not, my portfolio value was what it was.

So I looked. It was bad, but not nearly the shock of the last time (perhaps because percentage declines now translated to lower dollar amounts). I still had ample cash on hand as interest and dividends had accumulated over recent years.

So I stepped in and bought.

I won’t say I felt euphoric, but I felt better than I had in weeks, at least about my personal finances. I’d mustered the courage to face the truth, however grim. I’d acted according to a plan. I had more cash if needed for the next 10 percent decline.

My renewed confidence survived the next downdraft, which came the very next day.

‘Ashamed, foolish, like you screwed up’

This week I described my recent investing struggles to Frank Murtha, a managing partner of the consulting firm MarketPysch and an expert in behavioral finance. He said nothing I told him was unusual, even among seasoned investors.

My reluctance to look at my portfolio was common, he said. “Watching yourself have less money is painful,” he said. “It’s not just that you’re poorer. You also feel ashamed, foolish, like you screwed up. One of the toughest things is to separate your money from your ego and identity.”

He gave me credit for gathering the courage to face reality and then to buy. “Nothing relieves anxiety more than taking action,” he said. “You can take small actions that address the emotional need to do something without putting your finances at undue risk.”

Stocks are one of the few assets that psychologically become harder to buy as they become cheaper. “Every decision to buy is met with negative reinforcement,” Mr. Murtha said. Even he missed the great buying opportunity in March 2009. “I was too scared,” he said.

At least I didn’t commit what Mr. Murtha considers the most serious error, which is to sell into a steep decline. “That’s where people really get hurt,” he said. “Once you’re out, the emotional leverage works against you. Either the market drops further, which confirms your fear. Or it goes up, and you don’t want to buy after you just sold. Then it gets further and further away from you. People don’t realize how hard it is to get back in.”

The market soared. I felt no elation.

Nothing I experienced in the past prepared me for the speed of this market crash. The decline after stocks peaked in March 2000 lasted until October 2002 — two and a half years. The most recent bear market, which started in 2007, lasted 17 months. Nobody knows how long this bear market will last.

I take heart from this: During that previous bear market, the S&P was never down more than 50 percent from its 2007 peak. Even in the Great Depression, the worst bear market ever, the S&P dropped 86 percent. Small comfort, perhaps, but it never went to zero. And after those steep drops, the market not only recovered, but eventually went on to record highs.

This week brought some good news. My friend in Spain emerged from his coma. Doctors say his recovery will be slow, but they’re optimistic.

On Tuesday the market soared, followed by two more days of gains. This time I felt no elation. Some of the biggest rallies have come in the middle of the worst bear markets.

My next target is when the S&P falls 40 percent from its peak. I may be buying again soon.

-- by James B. Stewart, New York Times, 3/27/20

Thursday, March 26, 2020

market panics in hindsight

Do you remember where you were on Oct. 27, 1997?

Probably not. I don’t either. But on that day, the Dow plunged 550 points, which was roughly the same amount in percentage terms (7%) as today’s 2,000-point drop. In the late 1990s, the Asian financial crisis was the reason for that panic. But like many panics, as time passes, they seem to be much less meaningful in the rear view mirror.

Of course, this isn’t true for all panics. We will never forget events such as the 9/11 tragedy, or Sept. 15, 2008, when Lehman Brothers filed for bankruptcy, precipitating a swift run on the financial system and a severe economic contraction that the country hadn’t seen since the Great Depression. There was the Panic of 1893, which led to a depression that was arguably as severe as the Great Depression (and, in fact, was called just that until the Depression of the 1930s arrived). And, of course, there was the Great Depression itself.

But for each of these great panics, there are scores of smaller panics that seemed very significant at the time, but in hindsight look like nothing more than a blip on the radar.

The forgotten "panics"

Examples of such “mini-panics” that felt like full-blown panics at the time include the 1998 Russian debt crisis, where Moscow shocked the world by defaulting on their own ruble debt. The chaotic price movements in the markets crushed a hugely leveraged hedge fund called Long-Term Capital, which nearly drowned the banking system with its massive trading liabilities. The fund was bailed out by its own lenders (thanks to some strong-arming by the New York Fed) and this prevented the fund’s immediate liquidation, which stopped the panic.

Another panic occurred in 2011, where fears of a “double-dip” recession (remember that term?) coincided with political gridlock and a debt ceiling standoff that led to the first ever downgrade of the credit of the U.S. government. This seemed like a big deal at the time, and the market plunged roughly 17% from peak to trough, with many bank stocks and other cyclicals down 40% or more.

There was the Panic of 1907, where the failure of a major New York financial institution led to a city-wide run on the banking system, which drained liquidity from the economy and caused a sharp contraction as merchants couldn’t fund their inventory and corporations couldn’t make payroll. This crisis was historic because it eventually led to the creation of the Federal Reserve, but in fact the panic and subsequent downturn turned out to be very short-lived (I’ve written about this fascinating situation here and here).

And in the aforementioned 1997 panic, fast-growing Southeast Asian export nations (“Asian Tigers”) relied on foreign investment to finance their economic growth, but they went bust when rising U.S. interest rates made it harder to compete for foreign capital and a stronger dollar made exports less competitive for these dollar-pegged nations. The Tigers allowed money to freely flow into their countries in good times. But where money can easily enter, it can also quickly exit, and in 1997 an effective run-on-the-bank occurred in these nations, resulting in painful devaluations and economic collapses. This led to a major selloff across the world, and in fact was the last time (until today) that the U.S. stock market used its “circuit breaker” to shut down trading after markets plummeted.

There were even smaller scares such as the bond market debacle of 1994, the SARS outbreak in 2003, the “Flash Crash” in 2010 (also accompanied by the dreaded double-dip recession fear), the OPEC-fueled oil price rout (sound familiar?) that led to the worst start to the year in stock market history in 2016 and most recently, the trade war that caused a peak to trough drawdown of nearly 20% in the S&P 500 in the fourth quarter of 2018.

These mini-panics are only a small sample. There are countless examples that you can find when reading about the Go-Go years of the 1960s, the stagflation years of the 1970s and the junk bond years of the 1980s.

There are a number of lessons that can be learned by studying these past events, including the pattern of behavior that is so eerily similar in each of these panics, but there are two other takeaways I’ll mention here:

  1. Notice the number of Dow points that a 7% drop was in 1997.
  2. Notice how little you care about (or even remember) the vast majority of these mini-panics.

550 points used to be scary

Referencing Dow points is usually a useless exercise, but I use it to show how far the market has come from the days when a 550-point decline was a panic that required a temporary closure of the market.

My point is the stock market rewards investors who are long-term-oriented and patient. Investing isn’t easy, but it is simple. Owning a stake in a broad swath of American companies and ignoring the inevitable ups and downs is a surefire way to achieve success over time.

A quarter century from now, a 2000 point decline will likely be a much more normal 1% to 2% drop, just like a 550-point drop is today.

Stocks appreciate over time, and long-term investors get rewarded.

Time heals all wounds

Three years from now, we’ll all be looking back at this time as a great buying opportunity. It’s an extreme likelihood. I don’t know if this panic is going to get worse, and I never know in real time whether the panic is going to be the once-in-a-generation kind, but I do know that it is extremely unlikely. Nearly all panics wind up being “mini-panics” in hindsight, and they also turn out to be fabulous buying opportunities.

They are also viewed with relative indifference after a few years pass. Many people allow their memories of the fear to fade as time passes. Events that seemed important then are relatively meaningless now when filtered through the prism of time.

But they all seemed scary at the time.

And they were all great opportunities to buy stocks.

The time arbitrage loophole

I don’t know if this current coronavirus panic accelerates before it subsides, but I do know it will subside. And at some point, when enough time passes (often not much time is required), we’ll all agree that this was a great time to buy stocks.

What creates opportunity in markets is that in the current moment, we don’t all agree. Some view this as a buying opportunity, others think it’s a great time to sell stocks, or that it’s prudent to wait for “more clarity.” This disparity of interpretation is why stocks get mispriced. I’ve talked often about how Saber’s investment approach relies on time horizon edge, and this is a perfect example of why this approach can be successful over time. Stocks of great companies are getting sold because the earnings outlook looks bad this year, even when there is little debate about the long-term prospects for the business.

Some investors are in fact panic selling out of fear, others are more rationally selling because they don’t want to own a business that will have a bad year. And this creates opportunities for those who want to buy a stake in companies as a long-term part-owner.

Steve Jobs used to tell people to go for a walk and “zoom out”, to change your perspective and to look at the big picture. Sometimes it helps to zoom out and detach yourself from the current situation.

I don’t know what happens tomorrow or next week, or next month, or next year. But I am confident that we’ll look back in a few years and identify this as one of those times where it was great to be a buyer of stocks.

-- John Huber is the founder of Saber Capital Management, LLC. Saber is the general partner and manager of an investment fund modeled after the original Buffett partnerships. Saber’s strategy is to make very carefully selected investments in undervalued stocks of great businesses.

Wednesday, March 25, 2020

a technical look at this bear market

The current bear market is exhibiting many of the same "technical traits" as seen in both the "Dot.com" and "Financial Crisis."

In each previous case, the market experienced a parabolic advance to the initial peak. A correction ensued, which was dismissed by the mainstream media, and investors alike, as just a "pause that refreshes." They were seemingly proved correct as the markets rebounded shortly thereafter and even set all-time highs. Investors, complacent in the belief that "this time was different" (1999 - a new paradigm, 2007 - Goldilocks economy), continued to hold out hopes the bull market was set to continue.

That was a mistake.

Also, in each period, once the monthly "sell signal" was triggered from a high level, the ensuing correction process took months to complete. This not only reset the market, but valuations as well. In both previous periods, reflexive rallies occurred, which eventually failed. While the 2008 plunge following the Lehman crisis was most similar to the current environment, there was a brief rally following the passage of TARP, which sucked investors in before the additional 22% decline in the first two months of 2009.

Most importantly, the market got very oversold early in both previous bear markets, and stayed that way for the entirety of the bear market. Currently, the market has only just now gotten to a similar oversold condition.

What all the indicators currently suggest is that, while the current correction has been swift and brutal, bear markets are not resolved in a single month.

This is going to take some time.

Bear Market Rally

Over the past couple of weeks, we have been talking about a potential reflexive bounce.

From a purely technical basis, the extreme downside extension, and potential selling exhaustion, has set the markets up for a fairly strong reflexive bounce. This is where fun with math comes in.

As shown in the chart below, after a 35% decline in the markets from the previous highs, a rally to the 38.2% Fibonacci retracement would encompass a 20% advance. Such an advance will "lure" investors back into the market, thinking the "bear market" is over.

This is what "bear market rallies" do and generally inflict the most pain possible on unwitting investors. The reasons for this are many, but primarily investors who were trapped in the recent decline will use the rally to "flee" the markets permanently.


More importantly, as noted above, "bear markets" are not resolved in a single month. Currently, there are too many investors trying to figure out where "the bottom" is, so they can "buy" it.

Bear markets do not end in optimism; they end in despair.

Looking back at 2008, numerous indicators suggest the "bear market" has only just begun. While this does NOT rule out a fairly strong reflexive rally, it suggests that any rally will ultimately fail as the bear market completes its cycle.

This can be seen more clearly in the monthly chart below, which looks at both previous bull and bear markets using a Fibonacci retracement. As shown, from the peak of both previous bull market "bubbles," the market reversed 61.8% of the advance during the "Dot.com" crash, and more than 100% of the advance during the "Financial Crisis."


Given the current bull market cycle was longer, more levered, and more extended than both previous bull markets, a 38.2% decline is unlikely to fulfill the requirements of this reversion. Our ultimate target of 1600-1800 on the S&P 500 remains confirmed by the quarterly chart below.


The current correction process has only just triggered a quarterly sell signal combined with a break from an extreme deviation of the long-term bull-trend back to the 1930s. Both previous bull market peaks coincide with the long-term bull trend at about 1600 on the S&P currently. Given all the stimulus being infused into the markets currently, we broaden our bear market bottom target to 1600-1800, as noted.

The technical signals, which do indeed lag short-term turns in the market, all confirm the "bear market" is only just awakening. While bullish reflexive rallies are very likely, and should be used to your advantage, this is a "traders" market for the time being.

In other words, the new mantra for the market, for the time being, will be to "Sell Rallies" rather than "Buy The Dip."

Yes, the market will rally, and likely substantially so. Just don't forget to take action, make changes, and get on the right side of the trade, before the "bear returns."

Let me conclude by reminding you of Bob Farrell's Rule #8 from our recent newsletter:

Bear markets have three stages - sharp down, reflexive rebound and a drawn-out fundamental downtrend

  1. Bear markets often START with a sharp and swift decline.
  2. After this decline, there is an oversold bounce that retraces a portion of that decline.
  3. The longer-term decline then continues, at a slower and more grinding pace, as the fundamentals deteriorate.

Bear markets often START with a sharp and swift decline.

After this decline, there is an oversold bounce that retraces a portion of that decline.

The longer-term decline then continues, at a slower and more grinding pace, as the fundamentals deteriorate.

Dow Theory also suggests that bear markets consist of three down legs with reflexive rebounds in between.


The chart above shows the stages of the last two primary cyclical bear markets versus today (the 2020 scale has been adjusted to match.)

As would be expected, the "Phase 1" selloff has been brutal.

That selloff sets up a "reflexive bounce." For many individuals, they will "feel like" they are "safe." This is how "bear market rallies" lure investors back in just before they are mauled again in "Phase 3."

Just like in 2000, and 2008, the media/Wall Street will be telling you to just "hold on." Unfortunately, by the time "Phase 3" was finished, there was no one wanting to "buy" anything.

-- Lance Roberts, Real Investment Advice

Saturday, March 21, 2020

the four stages of a bear market

Typically, bear markets have four stages.

Stage one is recognition. Almost everybody shrugs off a bear market’s initial slide as being an ordinary event. The markets rise, and they fall. Treating every bad week as the bear’s arrival would not only shred one’s nerves, but would cause poor performance, should the investor act upon that instinct. Nine times of out 10, realizing a quick 5% or 10% loss would result in a permanent 5% or 10% loss, as stocks quickly return to their previous level.

This market achieved stage one during its third week. Stocks were up slightly for the year, before suddenly dropping 11% in the last week of February. In response, advisory firms issued reassuring notes about how these things happen, and market volatility is natural. The stock market surged the following Monday, failed to hold its gains, and then collapsed in week three—that is, last week. The bear was on.

Stage two is panic. This occurs when shareholders realize that the standard advice failed. Buying on the dip wasn’t easy money, as it is nine times in 10. Rather, it led to greater damage. Along with the pain (and regret) of unexpected losses comes the surprise that the conventional wisdom was wrong. Investors’ faith is tested—and some are found wanting. They sell first, then ask questions later.

We are currently in stage two. It could hardly be otherwise. Along with 1987’s bust, the current stock market crash—it fully deserves that name, with the Dow at the time of this writing being down 34% from its peak—has been the fastest stock-market descent since The Great Depression. It is difficult to apply rational analysis when so much happens, so quickly.

Stage three is stabilization. Stocks halt their decline, thereby ending the impression that they will do nothing but fall. The panic subsides but the situation remains grim. Investors believed during the first stage that stock prices slide on a whim. Now they realize that equities stumbled for good reason, and that until that reason is eliminated, they will continue to struggle. Shareholders’ losses will not soon be recouped.

This period is marked by turbulence. Stocks rally, sometimes furiously, only to be knocked back down. Investor sentiment varies between guarded optimism that the end is at least remotely in sight, and despair that the hope was false. This is typically the bear market’s longest period, extending for several months. (Several years for The Great Depression, but we do not wish to emulate that example.)

Stage four is anticipation. This is when stocks start their recovery. As with the bear market’s beginning, almost nobody recognizes its end until after the fact. The news at the time tends to be almost unrelievedly grim, accompanied by articles about how stocks’ golden days have passed. However, some investors perceive economic improvement distantly in the future. They make their bids, and stocks begin to rise.

A classic case occurred in March 2009. The recession was in its terrifying midst. Real U.S. gross domestic product declined that quarter, and the next quarter, and the quarter after that. The Morningstar Ibbotson Conference was held that month to empty seats, with the keynote speaker predicting several more months of equity losses. The rally began the next day.

Example #1: Black Monday

This is how the four stages played out 33 years ago:


Example #2: Financial Crisis

And this is how they operated more recently, from late 2008 through early 2009:


This scheme applies to bear markets that are primarily caused by recession fears. In addition to the two historic bears charted above, the scheme can be used to map the much smaller slump of 1990, and 1981’s decline, and 1970’s sell-off. Of course, the details for each of those markets vary, sometimes substantially—it would be reductive to imply otherwise—but the pattern is roughly similar.

However, the blueprint does not work for bear markets that arise from other causes. For example, the stock market’s grinding decline from 1973 through 1974 doesn’t map well to the four stages, because it was caused by steadily increasing inflation fears. The 2000-02 technology-stock implosion also fails the test, because the major concern as the New Era concluded was that equity prices had risen too high, not—aside from some of the Internet stocks—that earnings would disappear.

The question then becomes, does the current bear market fall into the first category or the second? 

The former would be greatly preferable. With that scenario, the enormous uncertainty about the spread of the coronavirus, and the economic damage that the containment efforts will wreak, disappears over the next few months. The problems will remain large and numbers, but they will at least be known quantities—and the financial markets are adept at planning for what is known.

Should the picture become clearer, the four-stage scheme figures to be relevant. Fairly soon, I should think, stocks will enter the third stage, that of stabilization. That doesn’t mean that they won’t decline further, but the struggle will at least be bounded. Within months, not years, the stock market recovery should begin.

On the other hand, should uncertainties remain high and unresolved, perhaps because the virus’s behavior confounds the scientists, or because the financial stimulus efforts prove ineffective, then all bets are off. I do not know how to analyze such a situation. I hope that I never shall.

-- John Rekenthaler, Morningstar

crises and the stock market

Comparing the Current Pandemic to the Spanish Flu Pandemic of 1918 and 1919

World War I was raging when the Spanish flu pandemic arrived, infecting some 500 million people worldwide (27% of the population) and killing roughly 40 million people, including 675,000 in the US alone.

There are a lot of takeaways from the Spanish flu pandemic’s effect on the world, but the stock market’s response may be the most surprising. If you look at the Dow Jones Industrial Average during the apex of the outbreaks (there were a few waves) in 1918 and 1919, you find that the index rose by just under 17% with dividends reinvested. Economic production from the war no doubt boosted activity during that time, and euphoria when the war ended in 1918 likely also contributed.

In all, this history lesson should serve as a stark reminder that the world can endure a world war and a lethal pandemic and still fight and grow through it. When the final wave of the Spanish flu subsided in February 1919, the market surged some 50% through November of that year. When a fear fades, stocks can surge.

This is a Good Reminder of How the Stock Market Works

In times like these, it’s also important for investors to take a step back and remember how the stock market works. Investors get long stretches of gains when the market trends higher (approximately +400% in this most recent bull run), and then from time to time, we experience clusters of scary downside volatility and bear markets when 20+% is quickly wiped out. But then when the crisis fades and fears abate, the next twelve months consistently delivers a strong comeback:


Long-term investors – and hopefully the folks who read my columns regularly – know that during a panic, an investor should look to snap up bargains as almost everyone runs for the exits. It’s the strategy of being “greedy when others are fearful,” as Warren Buffet put it. It sounds easy in theory, but it is very difficult in practice. In my view, now is a good time to buy stocks – it’s a better time than almost any other time since the ’08 crisis – it’s just psychologically almost impossible to implement. The history of the US economic system is a history of the triumph of the optimists. I believe the panic we see today will recede and money will transfer from those who panic to those who have a steady hand.

The issue is that there is no way to know when the market will stage its strong recovery, though history does tell us that it usually happens in close proximity to the scariest down days (much like the +9% surge we saw last Friday).6 Here’s a key stat to remember: over the last 20 years, 24 of the 25 worst trading days were within one month of the 25 best trading days.7 This speaks to the perils of trying to time exit and entry points during heightened volatility like we’re seeing right now. Doing so means potentially – if not probably – missing out on the market’s best rallies that every equity investor needs to drive long-term investing success.

-- Mitch on the Markets, 3/19/20

* * *

The top 10 worst bear markets (using the Dow), following the Great Depression, shows that it declines on average by -39.27%. And it lasts on average of 16.9 months.  [The market dropped 89.2% from top to bottom during the Great Depression.]

The biggest bear market in that study was the last one (10/2007-3/2009) during the housing/financial crisis. It was dubbed the Great Recession and the market plunged by -54.43%. But it’s worth noting that our economy and financial system back then were on pretty shaky ground. A starkly different situation than how we entered this one.

This bear market, at its worst, saw the Dow down by -35.98%, the S&P down by -32.29%, and the Nasdaq down by -31.67%.

Not that far from the average. Although, a ways to go to the worst case study.

But the rallies that followed have been even bigger. Within a year after a bear market, stocks surge on average of 44.74%. And go on to gain on average 66.34% by year 3.

Following the Great Recession, the market gained 63.40% in year 1; 100.58% by year 3; 153.58% by year 5; and more than 357% during the entire 11+ year bull market.

And given the strength of the economy going into this, it’s all the more likely that we’ll bounce back big and in record time.

Trading The Bear

Just like stocks need to fall by -20% for a bull market to end and a bear market to begin, they also need to go up by 20% for a bear market to end and a bull market to begin.

For the Dow, it needs to close at or above 23,008.78 for a new bull market to begin.

For the S&P, it’s 2,765.90.

And for the Nasdaq, it’s 8,255.42.

Set yourself an alert. When we close above those levels, the bear market will officially be over and a new bull market will have begun.

But that doesn’t mean you have to wait to start nibbling at your favorite stocks and their discount bargain prices.

Some may go lower. And some may not. But they are likely much lower now than where they were just a few short weeks ago. And much closer to the bottom (if they haven’t already hit it).

Riding The Bull

The big gains that follow a bear market can be quite spectacular.

But since a large part of any bull market recovery typically comes at the very beginning, it’s imperative that you stay in the market.

The trick is to get into the right stocks.

There’s nothing wrong with raising cash by getting out of your laggards and poorest performers – stocks you know you should have gotten out of long before this pullback even happened. Or getting rid of those stocks that will have an uphill battle recovering even when this is over.

But then make sure to replace them with the strongest stocks that will be the new market leaders.

The point is, you want to be building your dream portfolio now, near the bottom.

And by the time the new bull market is underway, you’ll be all in with the strongest stocks, and beating the market.

-- Kevin Matras, Weekend Wisdom, 3/20/20

* * *

Like last week, this week was another one for the history books. The SPX continued the triple-digit see-saw action that began last week and through Wednesday (3/18) had moved more than 4% (up or down) for 8 consecutive sessions. According to my calculations that has never happened before. However, the down days have been larger than the up days and as a result the SPX remains solidly in bear market territory. While the SPX did test the December 2018 correction low of 2,351 four times, it ultimately held (which is encouraging) so that support level remains.

SPX

Since the SPX remains in bear market territory, here is where this new bear market stands relative to other bear markets in history. As you can see, despite being only 29 days old, with a decline of 28.8% through Thursday (3/19) it has already surpassed 5 other bear markets in magnitude.

Bear Markets

Outlook:

While the virus outbreak seems to be accelerating outside of China, numerous monetary and fiscal initiatives have been announced to keep businesses solvent and employees paid. And while there are finally some indications of bargain hunting, two consecutive up days have not occurred since mid-February. Caution and patience is still advised.

-- Randy Frederick, Weekly Trader's Outlook, 3/20/20