"Trickle-down economics" and "the trickle-down theory" are terms in United States politics to refer to the idea that tax breaks
or other economic benefits provided by government to businesses and the
wealthy will benefit poorer members of society by improving the economy
as a whole.] The term has been attributed to humorist Will Rogers, who said during the Great Depression that "money was all appropriated for the top in hopes that it would trickle down to the needy." The term is mostly used ironically or as pejorative
Economist Thomas Sowell has written that the actual path of money in a private enterprise
economy is quite the opposite of that claimed by people who refer to
the trickle-down theory. He noted that money invested in new business
ventures is first paid out to employees, suppliers, and contractors.
Only some time later, if the business is profitable, does money return
to the business owners—but in the absence of a profit motive, which is
reduced in the aggregate by a raise in marginal tax rates in the upper
tiers, this activity does not occur.
Proponents of Keynesian economics
and related theories often criticize tax rate cuts for the wealthy as
being "trickle down," arguing tax cuts directly targeting those with
less income would be more economically stimulative. Keynesians generally
argue for broad fiscal policies that are directed across the entire economy, not toward one specific group.
In the 1992 presidential election, Independent candidate Ross Perot called trickle-down economics "political voodoo."
In New Zealand, Labour Party MP Damien O'Connor has, in the Labour Party campaign launch video for the 2011 general election, called trickle-down economics "the rich pissing on the poor".
A 2012 study by the Tax Justice Network indicates that wealth of the super-rich does not trickle down to improve the economy, but tends to be amassed and sheltered in tax havens with a negative effect on the tax bases of the home economy.
***
During the Reagan Administration
it seemed that trickle-down economics worked. Reagan cut taxes
significantly -- the top tax rate fell from 70% (for those earning
$108,000+) to 28% (for anyone with an income of $18,500 or more). The
corporate tax rate was also cut, from 48% to 34%. Reaganomics was successful in ending the 1980 recession. This was amazing, since the recession was marked by both double-digit unemployment and inflation, a dreadful situation known as stagflation.
However, it's difficult to say whether trickle-down economics was the
only reason for the prosperity. That's because, while Reagan cut taxes,
he also increased government spending
-- by 2.5% a year. Reagan nearly tripled the Federal debt, which went
from $997 billion in 1981 to $2.85 trillion in 1989. This spending went
primarily to defense, in support of Reagan's successful efforts to end
the Cold War and bring down the Soviet Union. Therefore, trickle-down
economics was never really tested, since government spending is also a
spur to economic growth.
To end the 2001 recession, President George W. Bush cut income taxes with JGTRRA, which ended the recession by November of that year. However, unemployment rose to 6%, so Bush cut business taxes with (EGTRRA) in 2003.
Apparently, the tax cuts worked. On the other hand, the Federal Reserve lowered the Fed funds rate
from 6% to 1% during this same time period. Just like during the Reagan
Administration, it's unclear whether tax cuts, or another stimulus,
were what worked.
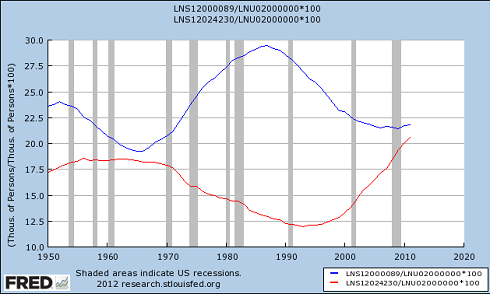
If trickle-down economics worked, then lower tax rates during the Reagan
Revolution should have increased the lowest income levels. In fact, the
exact opposite has occurred. Income inequality
has worsened. Between 1979 and 2005, after-tax household income rose 6%
for the bottom fifth of income earners. That sounds great, until you
see what happened for the top fifth -- an 80% increase in income. The
top 1% saw their income triple. Instead trickling down, it appears that
prosperity trickled up!
***
Helping to clinch his eventual victory, Barack Obama declared in a 2008 presidential campaign ad, "The old trickle-down theory has failed us" [source: YouTube].
This statement and Obama's victory resound like a death knell to an
economic mentality that some say served to line the pockets of the rich.
However, the trickle-down theory to which he refers remains a highly
controversial topic. That Obama seeks to end trickle-down policy is
certain, but what the theory really suggests and whether it has
succeeded have been less clear.
Why do trickle-down economists think that taxing the wealthy less
leads to an increase in production? That can be explained in terms of
tax revenue. Some argue that giving tax breaks
to the wealthy can actually increase tax revenue for a government. This
might seem difficult to believe, but Arthur Laffer argued otherwise.
Working off ideas posed by 14th-century Muslim philosopher Ibn Khaldun
and John Maynard Keynes, Laffer concluded that government tax rates and
revenues don't have a directly positive correlation.
In what became known as the Laffer Curve,
Laffer showed that the relationship between taxes and revenues looks
like a curve rather than a straight line. In other words, tax revenues
don't rise consistently like tax rates do (which would look like a
straight, positive correlation). Laffer's curve shows that when tax
rates are at zero, revenues are zero as well -- the government makes no
money when it taxes nothing. But it's the same result if the tax rate
were 100 percent. Think about what would happen if the government
demanded every cent in your paycheck. Why work -- or why tell the
government what you're making? The government would bring in no money
because there'd be no incentive to work or to report earnings.
So
tax revenues are zero when the tax rates are at zero and 100 percent --
most agree about that. The question is, what does it look like between
these extremes? The Laffer Curve postulates that once the rates get too
high, the steep taxes discourage work to an extent that the revenues
themselves suffer. Take another scenario: By June, you've already made a
million dollars, and the progressive tax system promised to tax that
income 50 percent. However, anything you make over a million will be
taxed 90 percent. Why work the rest of the year when you know you can
only keep 10 percent of your income? You'd probably take your half a
million and retire to your beach house until next year. At this point,
the taxes are discouraging work and tax revenue.
The range in which taxes are too high for maximum revenues is called the prohibitive range. When taxes are in the prohibitive range, a tax cut would produce an increase in tax revenues, according to Laffer [source: Laffer]. But the ideal tax isn't necessarily 50 percent; rather, it depends on the taxpayers [source: Wanniski].
Through
Laffer's Curve, we can visualize how tax rates could discourage people
from producing, which results in fewer jobs and a hurting economy. On
the flip side, lowering taxes at the right time can reverse these
effects. Laffer points to examples in U.S. history where lowering high
tax rates increased not only government revenue, but also increased
gross domestic product (GDP) growth and lowered the unemployment rate
[source: Laffer].
The first instance of supply-side economics being implemented came
even before the trickle-down idea was fully articulated. After World War I,
top income tax rates had risen from a modest 7 percent to 77 percent to
help pay for the war. This high rate would fall into the prohibitive
range of the Laffer Curve, according to the theory. The Harding and
Coolidge administrations passed a series of tax cuts to reduce wealthy
citizens' tax burden, which had ballooned. Although opponents argue that
this kind of policy contributed to the Great Depression, Arthur Laffer
points to the resulting increases in tax revenue, gross domestic product
(GDP) and employment as evidence that the tax cuts worked by boosting
production [source: Laffer].
But this policy soon faced sharp criticism. When the stock market crashed
in 1929 and the U.S. economy sank into the Great Depression, the idea
of giving tax breaks to the wealthy was an unpopular policy. People
blamed Herbert Hoover, who'd shown support for the tax policies of his
predecessors. In 1932, voters replaced him with Franklin Roosevelt, who
promised the New Deal that would help the economy from the bottom up. Keynesian economics took hold.
Wealthy members of society who'd enjoyed the low marginal tax rates of
the 1920s would see a dramatic reversal in the next 20 years. During the
Depression and World War II, the top marginal rate rose to more than 90 percent [source: Laffer].
Enter John F. Kennedy, who was sympathetic to the idea behind
supply-side economics (recall his "rising tide" comment). He argued that
lowering taxes increases tax revenue, creates jobs and increases
profits [source: Nugent].
His tax cuts didn't pass until after he was assassinated, but Laffer
argues that they had the positive effect on the economy that Kennedy had
hoped for. Others say that the cuts hurt the gross national product
(GNP) growth and resulted in rising unemployment [source: Friedman].
***
So from all this, I conclude it could work as the Laffer Curve concept makes sense to me. The question is what tax rate to set and not to just reflexively raise or lower taxes. And how do you know if it's effective (how long to wait for the results)? Whatever they're doing it ain't working because it appears the middle class ain't getting richer. We're just getting more dead money at the top.
It kind of makes sense to me to raise taxes in times of war (to pay for the war). And lower taxes in times of peace. Kind of the opposite of what Bush did and what Obama wants to do with the (hopefully) ending of war.
Wednesday, September 12, 2012
Saturday, September 08, 2012
gold standard coming back?
Pundits are pooh-poohing the plank in the GOP platform that calls for
a commission to examine “possible ways to set a fixed value for the dollar,” declaring it a sop to Ron Paul supporters. And indeed this was a
motivation of hard-core political calculators around Governor Romney.
But these self-styled, world-weary cynical types didn’t put this item in
of their own volition. They went along with it because it was pushed
hard by Tea Party groups and several U.S. senators and representatives,
as well as Ron Paul devotees.
Gold won’t be a sizzling issue this fall. The economy, entitlements and, possibly, war in the Middle East will dominate headlines. But the yellow metal will be a hot topic in the next 24 months. The commission is going to take on an importance that will astound today’s political punditry, besotted as they are with stale Keynesian quackeries about money, taxes and spending.
Why? Events economic and political. The ever deepening financial crisis around the world will force the new Romney-Ryan Administration to consider–and quickly, too–dramatic measures to deal with the disaster.
-- Steve Forbes (via pbo)
Friday, September 07, 2012
September is the cruelest month
[9/1/09] September historically has been so bad for the stock market that, even in the absence of a good explanation for why it should be such a poor performer, you may want to pull a few chips off the table.
Consider September's record back to 1896, when the Dow Jones Industrial Average was created. September on average since then has produced a return of minus 1.2%, in contrast to an average gain of 0.7% for all other months. No other month comes even close to such a dismal record.
Making the statistical case against September even stronger is the remarkable consistency of its poor performance. Consider the accompanying table, which shows how September ranks against all other months of the calendar in each of the last 11 decades, as judged by the Dow.
Notice from the table that in all but one of the last 11 decades, September was a below-average performer. In more than half the decades, in fact, the month's rank was dead last.
Why, given such an overwhelming record, would anyone question September's bad record? Because there is no good theory for why the month should be such an awful month for the stock market. And, without such an explanation, there's the distinct possibility that the statistical pattern is just a fluke.
[iluvbabyb]
[9/7/12] So the real question facing these investors who are having cold feet: Is there some reason to expect this coming September to buck the trend of Septembers past?
Consider September's record back to 1896, when the Dow Jones Industrial Average was created. September on average since then has produced a return of minus 1.2%, in contrast to an average gain of 0.7% for all other months. No other month comes even close to such a dismal record.
Making the statistical case against September even stronger is the remarkable consistency of its poor performance. Consider the accompanying table, which shows how September ranks against all other months of the calendar in each of the last 11 decades, as judged by the Dow.
| Decade | Sept rank | Sept ave return |
| 1901-1910 | 12th | -2.6% |
| 1911-1920 | 2nd | +2.9% |
| 1921-1930 | 12th | -2.8% |
| 1931-1940 | 10th | -3.2% |
| 1941-1950 | 8th | +0.4% |
| 1951-1960 | 12th | -1.2% |
| 1961-1970 | 9th | +0.4% |
| 1971-1980 | 12th | -1.3% |
| 1981-1990 | 12th | -1.8% |
| 1991-2000 | 10th | +0.2% |
| 2001-2008 | 12th | -3.0% |
Notice from the table that in all but one of the last 11 decades, September was a below-average performer. In more than half the decades, in fact, the month's rank was dead last.
Why, given such an overwhelming record, would anyone question September's bad record? Because there is no good theory for why the month should be such an awful month for the stock market. And, without such an explanation, there's the distinct possibility that the statistical pattern is just a fluke.
[iluvbabyb]
[9/7/12] So the real question facing these investors who are having cold feet: Is there some reason to expect this coming September to buck the trend of Septembers past?
The analysis I presented in one of my columns earlier this week, you may
recall, failed to find any historical statistical support for such an
expectation — even given the market’s strength in recent months. (
Read my Sep. 4 column, “September is a downer.”
)
Naturally, this hasn’t completely persuaded everyone, especially in
light of Thursday’s very strong market. So let me present more evidence:
The remarkable consistency with which September has been a poor
performer.
In fact, as you can see from the accompanying table, September on
average has been the worst month of the calendar in nearly half the
decades of the last century — and a below-average performer in all but
one of them. The chances that this record is the result of random chance
are extremely low.
The bottom line? Even if you didn’t know or appreciate it at the time,
September is the month you were really trying to avoid by selling in May
and going away.
Thursday, September 06, 2012
Paul Ryan's investments
The report shows that Ryan has spread his wealth among a wide variety
of investments. Ryan reported partnership income from an Oklahoma
mining business, Ava O Limited Co., and royalties from the Oklahoma
gravel rights of Blondie & Brownie. He also reported interests in
mineral rights, vacant land, a cabin and a timber business in Oklahoma.
Ryan’s stock holdings include Apple, Bristol Myers Squibb, Exxon Mobil, General Electric, Home Depot, IBM, Procter & Gamble, Wells Fargo, Google, McDonald’s, Kraft Foods, Nike and Berkshire Hathaway.
Not to mention Fidelity Contrafund.
All this makes him the 128th richest congressman.
The 15 richest? (No. 15 is worth $23.8 million, 9 of the 15 are Democrats.)
***
How Obama made his fortune
Tuesday, September 04, 2012
Three economic misperceptions
1. Lower taxes lead to faster economic growth
2. We need to pay off the national debt
3. It matters who wins the presidency.
- by Morgan Housel
2. We need to pay off the national debt
3. It matters who wins the presidency.
- by Morgan Housel
stock market performance under Democrats
Thanks to their pro-business approach and the anemic recovery,
Republicans would seem to have a clear path to grab the economic mantle
heading into the 2012 race for the White House.
However, history actually shows that the U.S. economy, stock prices and corporate profits have generated stronger growth under Democratic administrations than Republican ones.
According to McGraw-Hill’s (MHP: 51.48, +0.28, +0.55%) S&P Capital IQ, the S&P 500 has rallied an average of 12.1% per year since 1901 when Democrats occupy the White House, compared with just 5.1% for the GOP.
Likewise, gross domestic product has increased 4.2% each year since 1949 when Democrats run the executive branch, versus 2.6% under Republicans.
Sunday, September 02, 2012
Buffett's Alpha
While much has been said and written about Warren Buffett and his investment style, there has been little rigorous empirical analysis that explains his performance. Every investor has a view on how Buffett has done it, but we seek the answer via a thorough empirical analysis in light of some of the latest research on the drivers of stock market returns.
Buffett’s record is remarkable in many ways, but just how spectacular has the performance of Berkshire Hathaway been compared to other stocks or mutual funds? Looking at all U.S. stocks from 1926 to 2011 that have been traded for more than 30years, we find that Berkshire Hathaway has the highest Sharpe ratio among all. Similarly, Berkshire has a higher Sharpe ratio than all U.S. mutual funds that have been around formore than 30 years.
We find that the Sharpe ratio of Berkshire Hathaway is 0.76 over the period 1976-2011. While nearly double the Sharpe ratio of the overall stock market, this is lower than many investors imagine. Adjusting for the market exposure, Berkshire’s information ratio is even lower, 0.66. This Sharpe ratio reflects high average returns, but also significant risk and periods of losses and significant drawdowns.
If his Sharpe ratio is very good but not unachievably good, then how did Buffett become one of the most successful investors in the world? The answer is that Buffett has boosted his returns with leverage, and that he has stuck to a good strategy for a very long time period, surviving rough periods where others might have been forced into a fire sale or a career shift. We estimate that Buffett applies a leverage of about 1.6-to-1, boosting both his risk and excess return in that proportion. Thus, his many accomplishments include having the conviction, wherewithal, and skill to operate with leverage and its risk over multiple decades.
This leaves the key question: How does Buffett pick stocks to achieve a relatively attractive return stream that can be leveraged? We identify several features of his portfolio: He buys stocks that are “safe” (with low beta and low volatility), “cheap” (i.e.,value stocks with low price-to-book ratios), and high-quality (meaning stocks that [are] profitable, stable, growing, and with high payout ratios). This statistical finding is certainly with Buffett’s writings, e.g.:
Whether we’re talking about socks or stocks, I like buying quality merchandise when it is marked down – Warren Buffett, Berkshire Hathaway Inc., Annual Report, 2008.
Friday, August 31, 2012
energy independence
As it turns out, we have found so much natural gas and oil in this
country, with the new procedures and the new technology, that we can
become energy independent in less than ten years, maybe even by the end
of the decade.
If we start exporting natural gas, which we will in less than four years, from McAllen Texas there will be the first LNG terminal, just the one in McAllen is going to produce $70 to $80 billion a year of positive trade balance.
If we start exporting value-added natural gas, in the form of fertilizers and plastics and other products that you make from natural gas, we could have a positive trade balance in less than ten years. That would be a shock to the world. Nobody sees that coming.
massive economic catastrophe
Once again, it's time for our daily dose of morning cheer..
In a newly released documentary that went viral last month, a team of influential economic experts say they have discovered a "frightening pattern" they believe points to a massive economic catastrophe unlike anything ever seen in the history of the world.
And according to these experts - who have presented their findings to the United Nations, the UK Parliament and a long list of world governments - the catastrophe may happen well before Americans hit the polls in November.
"What this pattern represents is a dangerous countdown clock that's quickly approaching zero," said Keith Fitz-Gerald, the Chief Investment Strategist for the Money Map Press, who predicted the 2008 oil shock, the credit default swap crisis that helped bring about the recession, and the Greek and European fiscal catastrophe that is still wreaking havoc until this day.
"The resulting chaos is going to crush Americans."
Saturday, August 25, 2012
fading affect bias
There's a theory in behavioral psychology called the fading affect bias. In simple terms, it states that negative emotions leave our memories much faster than positive ones -- a sort of natural aversion to unpleasant thoughts.
In 1948, psychologist Sam Waldfogel gave a group of participants 85 minutes to write down every event they could remember from the first eight years of their life, and rank them as pleasant, unpleasant, or neutral. Logically, events should have been spread evenly between the three. But they weren't. Pleasant memories outweighed negative ones by almost twofold. People had a distinct positive bias when recalling their past.
So, what's this mean for your investments? People worry and the economy slows down. Then they get over it and it recovers. Same story again and again. John Maynard Keynes called these shifts animal spirits -- "a spontaneous urge to action rather than inaction." The important thing is that they happen consistently and predictably. You get to choose whether you want to stop worrying before the crowd, or wait and follow the crowd. It's the epitome of being fearful when others are greedy, and greedy when others are fearful. And it may be the single largest factor in determining whether you'll be a successful investor or not.
Wednesday, August 22, 2012
Echo Boomers
Liz Ann Sonders writes:
In history, few forces have been as strong behind stock returns as demographic trends: movements in population, age, gender and employment status, among others. Much focus has been on Baby Boomers, especially as they begin to retire, and their effect on markets in the future. Yes, they're now more risk-averse than ever, and this is not likely to change. But what about a key generation behind them?
Those born after 1980 are generally considered "Millennials," but I prefer the description "Echo Boomers," as they represent many of the children of Baby Boomers. Millennials are often characterized as having less financial savvy and weaker job prospects than their Boomer parents. The result is an impression of a generation equally as disenfranchised from the stock market as the Baby Boomers.
However, I think many may be underestimating the positive impact this generation may have on investing trends. I recently read an interesting report on the subject by Turner Investments in which it noted that the Millennials are "digital natives"—the first generation raised with technologies such as personal computers, the Internet and smartphones that prior generations had to adapt to later in life.
My two children (ages 12 and 16) can't fathom that I had to rely on libraries, books, encyclopedias and a typewriter when I was a college student. But they're part of a generation that's become completely reliant on "new" technologies. Eight of 10 of Millennials sleep with their cell phones in reach (count my kids in the 20% that don’t, though they would if we let them).
The Millennials are highly educated: About 40% of college-age Millennials are enrolled in higher education—the greatest percentage in US history. Yes, some of that's a result of the rough economic ride they've been on over the past decade or so. They've had to suffer two economic/market crises since 2000, starting with the bursting of the technology bubble and followed by the bursting of the housing bubble and the attendant financial crisis. The dearth of jobs has hit the generation particularly hard. About a third of 18-29 year olds are unemployed, under-employed or simply out of the work force.
Don't underestimate the Millennials
Turner offers seven reasons why the financial prospects of Millennials may be much better than is popularly supposed and why Millennials may "bring about a Great Bull Market of the 21st Century":
1. The Millennial generation is huge at more than 85 million—even larger than the Baby Boomers' 81 million. It wasn't until Boomers were in their 30s that they began to truly make their presence felt in the stock market. The great bull market of the last century was the result. My additional perspective: vehicles like 401(k)s make it easier and more "automatic" for this cohort to invest.
2. Millennials' financial struggles thus far are actually fairly typical of early adult life: paying for education, finding a first job, relocating, buying a first house and learning the vocational ropes.
3. Macroeconomic headwinds facing Millennials—notably high unemployment and depressed housing—are likely to be temporary. My additional perspective: housing has likely already found its bottom and household formation has jumped significantly since its lows.
4. Baby Boomers once faced similar macroeconomic headwinds (during the late 1970s and early 1980s), but were still able to subsequently invest in stocks and drive the market to new highs during their peak earning years.
5. Despite all of their financial troubles, Millennials are savers and are already investing in stocks. Twenty-something investors have more stocks in their 401(k) accounts today than their counterparts did a decade ago, according to the Investment Company Institute. About 80% of 20-somethings had devoted at least 60% of their 401(k)s to stocks in 2010 (the latest year of data) versus 70% in 2000.
6. Millennials tend to be optimists and are more willing to take risks relative to their parents' generation. About 29% of all entrepreneurs are Millennials, according to the Kaufman Foundation, suggesting an appetite for risk.
7. Millennials are putting emerging nations in a demographic sweet spot. The ratio of workers to the total populace in East Asia rose from 47% in 1975 to 64% in 2010. In Latin America the ratio rose from 44% to 56%, and in South Asia it rose from 45% to 55%. A sizable new class of investors is surfacing around the globe.
Food for thought.
Kass bearish
“It is time to say good bye to the bullish days of summer,” says Doug
Kass, a hedge-fund manager at Seebreaze Partners. “We might now be
approaching a crucial inflection point in the world’s equity markets.”
Kass says he is “more bearish” now than he has been in quite some time, largely due to several metrics pointing toward extreme levels of complacency. He notes sentiment polls, fund-flow data and a low VIX as well as troubling economic fundamentals as evidence to be cautious.
“I am very concerned about the potential for a disappointing downturn in corporate profits, the likely deterioration in China’s economy and a more rapid decline in the eurozone’s economy than is generally expected in the months ahead,” Kass says. I will move back into a long position when conditions dictate, but, for now, with extreme levels of complacency, I am more bearish than I have been in a while.”
Monday, August 20, 2012
the history of tax rates
Contrary to what many think, tax rates have generally been decreasing since the 1970s. The top rate in the 1970s used to be 50%, declined to as low as 28%, and is now 35%. The top long-term capital gain rates used to be 39.9% and is now 15%. The top dividend rate used to be 70% (!) and is now down to 15%.
[Now, I see the top tax rate used to be 7% in 1913, then more than doubled to 15% in 1916, then zoomed to 67% in 1917. It reached as high as 92% in 1952. [The capital gain tax rate has ranged from 7% to 49.88% (in 1977). And the dividend tax rate has ranged from zero to fully taxable (100% of the ordinary income rate).]
Should you sell some securities now, before long-term capital gains rates go up? Currently, profits on long-term investments (those held more than one year) are taxed at a top rate of 15%. The Obama Administration has proposed raising the top rate back to 20% for families making over $250,000 and keeping it at 15% for everyone else. If Congress takes no action, the top rate is scheduled to return to 20% for securities held between one and five years, and 18% for those held more than five years for everyone (23.8% and 21.8% respectively including the new healthcare law surtax for high earners).
Tuesday, August 14, 2012
Bloomberg Billionaires Index
I was familiar with the Forbes 400, but not this index of billionaires worldwide.
Carlos Slim tops the list with 72.7 billion
Bill Gates is second at 63.5 billion
Warren Buffett is third at 45.5 billion
Barely ahead of Amancio Ortega Gaona at 45.1 billion
Surprisingly Larry Ellison is not far behind at 40.0 billion and could easily overtake Buffett should ORCL continue to outperform BRK.A.
Looking at the 2010 Forbes 400 list, Buffett was comfortably ahead of Ellison 45 to 27. Then again, in 2000, it was Ellison 58, Buffett 28.
And now I see that Forbes has their own list of billionaires and lists Bernard Arnault fourth at 41B. Arnault is 15th on the Bloomberg list at 25.0 billion.
Monday, August 06, 2012
how important is turnover?
Overall, turnover proved to have a smidgen of predictive power, but
it was not as strong or consistent as the best predictors. While fees,
stars, and manager tenure produced a nice stair-step down, the turnover
results were lumpier. So while the cheapest quintile beats the
next-cheapest quintile and so on, turnover didn't work that way.
Instead, we had rather flat results up until the highest-turnover quintile, where results really plummeted. So, put turnover behind stars, expenses, and manager returns, but put it ahead of active share. Along asset-class lines, turnover had some predictive power for equity funds. Shopping for low-turnover balanced funds would have actually hurt performance, and turnover had no effect--positive or negative--in bond funds. No big surprise there.
The results are pretty close to what other studies have found. For example, Roger Edelen, Richard Evans, and Greg Kadlec found a small impact for turnover in their paper, "Scale Effects in Mutual Fund Performance: The Role of Trading Costs." However, in their study it wasn't as powerful as expense ratios or their estimate of trading costs.
[see also]
Wednesday, July 25, 2012
SmartMoney out of print
NEW YORK, Jun 21, 2012 (GlobeNewswire via COMTEX) -- Dow Jones &
Company announced today that SmartMoney, the personal finance magazine
from The Wall Street Journal, will make a digital transition that will
include the expansion of its digital news team. As part of the
transition, the print edition of SmartMoney will cease production this summer, and the magazine's September issue, on newsstands August 14,
will be the final issue.
"SmartMoney has led the way in personal finance coverage for 20 years. It has been honored with many awards and provided intelligent, objective analysis and guidance for readers in print and online. It's clear that the volatility of markets and asset classes has increased the need for rapid delivery of personal finance intelligence, so we will be expanding our team and presence on the web," said Robert Thomson, editor-in-chief of Dow Jones & Company and managing editor of The Wall Street Journal. "The team should be extremely proud of what it has achieved and be excited by the prospect of what it will achieve."
In addition to SmartMoney.com, all content and tools from the site will be available on an expanded co-branded personal finance section on MarketWatch.com. This move also extends the digital reach of the SmartMoney brand to MarketWatch's nearly 17 million monthly visitors from SmartMoney.com's 2.5 million monthly visitors.
Saturday, July 21, 2012
100 Mind-Blowing Facts About the Economy
Morgan Housel relates some interesting numbers. Here are some of them.
1. The unemployment rate for men is 8.4%. For married men, it's 4.9%.
2. The unemployment rate for college graduates is 3.9%. For high school dropouts, it's 13%.
3. According to The Wall Street Journal, in 2010, "for every 1% decrease in shareholder return, the average CEO was paid 0.02% more."
7. China's labor force grew by 145 million from 1990 to 2008. The entire U.S. labor force today is 156 million.
8. In 1998, oil industry executives told Congress that oil would average $10 a barrel for the following decade. In reality, it averaged $44.9 a barrel.
9. In 1999, one of the best years for the market ever, more than half of stocks in the S&P 500 declined. Two companies, Microsoft (Nasdaq: MSFT ) and Cisco, accounted for one-fifth of the index's return.
12. China's working-age population is expected to shrink by more than 200 million between now and 2050. The U.S.' is expected to rise by 47 million.
16. In Russia, 0.00007% of the population (100 people) controls 20% of the wealth. [talk about the 1%..]
19. For the 2012-2013 fiscal year, California will spend $8.7 billion on prisons and $4.8 billion on its UC and state college systems.
24. The U.S. makes up less than 5% of the world's population, but a third of the world's spending on pharmaceuticals, according to the IMS Institute for Healthcare.
25. Average monthly rent in New York City ($2,935) is about the same as the nationwide average monthly income ($3,052).
27. In 1929 -- the golden year before the Great Depression-- 60% of American households earned a wage below what Brookings Institution economists classified as "sufficient to supply only basic necessities." Well over half the country lived in poverty, in other words. One-fifth of households earned half the poverty wage.
30. Since 1994, stock market returns are flat if the three days before the Federal Reserve announces interest-rate policy are removed.
33. If you earn minimum wage, you'll need to work 923 hours to pay for a year at an average public four-year college. In 1980, it took 254 hours.
43. Ten percent of Medicare recipients who received hospital care made up 64% of the program's hospital spending in 2009, according to The Wall Street Journal.
45. As a percentage of GDP, government spending was higher in 1983 under President Ronald Reagan than it will be this fiscal year (23.5% vs. 23.3%, respectively), according to data by the Tax Policy Center.
46. More government jobs were eliminated on net in 2010 than in any other year since at least 1939. As a percentage of government workers, the decline was the largest since 1947.
47. According to Sheldon Jacobson of the University of Illinois, the added weight carried by vehicles due to obesity in America consumes an additional 938 million gallons of gasoline a year.
48. The median American family's net worth fell to $77,300 in 2010 from $126,400 in 2007, according to the Federal Reserve's Survey of Consumer Finance. That erased nearly two decades of accumulated wealth.
49. According to UCLA: "Only 3.1 percent of the world's children live in the United States, but U.S. families buy more than 40 percent of the toys consumed globally."
51. A study of retired investors between 1999 and 2009 showed those who hired a stockbroker underperformed those managing their own money by 1.5% a year. "Fees accounted for only about half the gap," writes Jason Zweig of The Wall Street Journal.
60. Since 1968, the U.S. population has increased from 200 million to 314 million, and federal government employees have declined from 2.9 million to 2.8 million.
61. According to the Boston Consulting Group, manufacturing wages, benefits and taxes are $22.30 an hour in America, compared with $2 an hour in China. But since American factory workers are more productive, China's effective labor costs are only 55% lower than Americans, and may drop to less than a third later this decade.
65. As of June 2011, 32% of American homes were cellphone only, up from 17.5% in 2008, according to the National Center for Health Statistics.
66. Solar panel prices have plunged 82% since 2009, according to Bloomberg.
71. In 1989, the CEOs of the seven largest U.S. banks earned an average of 100 times what a typical household made. By 2007, more than 500 times.
72. In 1990, the three largest U.S. banks held 10% of the industry's assets. By 2008, the top three controlled 40% of the assets.
73. Clean water and sewers were voted "the greatest medical advance" since 1840 by readers of the British Journal of Medicine.
75. America is home to less than 5% of the world's population, but nearly a quarter of its prisoners.
79. In May this year, the Dow fell 18 days and rose four days -- the worst combination since 1903. It never posted two consecutive gains, likely for the first time ever.
81. According to John Cawley of Cornell and Chad Meyerhoefer of Lehigh University, obese people incur annual medical costs $2,741 higher than non-obese people, or almost $200 billion nationwide.
82. According to economist Christina Romer, real GDP per capita in American grew 0.58% a year from 1800-1840; 1.44% from 1840-1880; 1.78% from 1880-1920; 1.68% from 1920-1960, and 1.82% from 1960-1991. We not only grew richer, but at an increasing rate.
83. In 2007, the Congressional Budget Office estimated federal tax receipts would be $3.4 trillion in 2012. In reality, they'll be around $2.5 trillion.
86. According to economists Thomas Piketty and Emmanuel Saez, 80% of all income growth from 1980 to 2005 went to the top 1% of wage earners.
88. If you're fed up with unemployment caused by offshoring, you'll love this: According to a 2006 Government Accountability Organization study, the processing of unemployment insurance claims are partially offshored in several states.
90. We tend to underestimate how powerful the agriculture boom has been in the last century. The 1952 book The Big Change describes life in America in the year 1900: "In most parts of the United States people were virtually without fresh fruit and green vegetables from late autumn to late spring."
92. According to biographer Ron Chernow, John D. Rockefeller's net worth peaked at $900 million in 1913. That equaled 2.3% of the U.S. economy. A comparable net worth today would be $340 billion, or eight times richer than Warren Buffett.
94. According to Morgan Stanley, 9% of all S&P trading volume is in Apple stock. One in 25 of all hedge funds has more than 10% of their fund in Apple.
96. America is aging. Older workers (age 55+) are about to overtake younger workers (age 25-34) for the first time.
97. According to the Pew Research Center, every one of the eight largest EU nations ranks Germany as the hardest working -- except for Greece, which ranks itself as the hardest working. Five of the eight rank Greece as the least hardworking.
98. In 1900, the standard American workweek was 10 hours a day, six days week. Historian Frederick Lewis Allen notes in a 1952 essay: "If anybody had suggested a five-day week he would have been considered demented."
99. Facebook (Nasdaq: FB ) claims 100 billion friend connections have been made on its social network. That's about the same number of humans that have ever lived since 50,000 B.C., according to the Population Reference Bureau.
For more on the recession's impact on the economy, check out my latest e-book, 50 Years in the Making: The Great Recession and Its Aftermath for your iPad, Kindle, on Amazon or Barnes & Noble. It's short, packed with information, and costs less than a buck.
***
[8/3/12] The economy has added 4 million jobs since February 2010, when the jobs market bottomed. But that's just 46% of the 8.78 million jobs lost between February 2008 and the 2010 low. About 4.5 million private-sector jobs were added in that period, which means public-sector employment fell by a half million. Most of that is in the state and local government sectors, primarily in education.
Friday, July 13, 2012
too much credit?
We often hear that one of America's great strengths is the depth of
its financial markets. That's true to a point, but there are limits. A
new study by the International Monetary Fund shows that rich countries
hit a point "at which financial depth no longer contributes to increasing
the efficiency of investment."
That point, they showed (link opens PDF file) this week, tends to hit when a country's private sector debt totals 80%-100% of gross domestic product. The United States hit that threshold two decades ago, and now chugs along at about double the level:
That point, they showed (link opens PDF file) this week, tends to hit when a country's private sector debt totals 80%-100% of gross domestic product. The United States hit that threshold two decades ago, and now chugs along at about double the level:
does the Fed drive the stock market?
In one of the most startling studies I've ever seen, researchers from the Federal Reserve this week measured
how much the stock market is influenced by...the Federal Reserve. Their
conclusion: "Since 1994, [stock] returns are essentially flat if the
three-day windows around scheduled FOMC announcement days are excluded."
The Federal Reserve announces what it's going to do to interest rates eight times a year at Federal Open Market Committee meetings. These are scheduled in advanced and well-publicized, so investors know exactly when the goods are coming.
Since 1994 (when the Fed started publicizing its moves), the S&P 500 has risen from 450 to 1300. But remove the 24 hours just prior to FOMC announcements, and returns fall to almost nothing:
interview with Buffett, Simpson, Bowles
This is a transcript of Warren
Buffett, Alan Simpson, and Erskine Bowles' Sun Valley live interview on
CNBC's Squawk Box, July 12, 2012, from 8am to 9am ET.
They discussed why the U.S. needs to address its mounting debt problem and suggested some solutions.
[via cougar3]
[via cougar3]
Thursday, July 12, 2012
10 Myths About Social Security
The myths deal mainly about the notion that Social Security is going broke.
While that might not be technically true, reading the article, all the myths seem to have an element of truth. So to me, they're not really myths.
[10/16/12] 5 Huge Myths About Social Security
[3/6/13] 5 ways to fix Social Security
[7/11/14] A brief history of Social Security
While that might not be technically true, reading the article, all the myths seem to have an element of truth. So to me, they're not really myths.
[10/16/12] 5 Huge Myths About Social Security
[3/6/13] 5 ways to fix Social Security
[7/11/14] A brief history of Social Security
Wednesday, July 11, 2012
a look at the archives
Now let's talk S&P 500 earnings.
It's 2007, and the stock market is booming to an all-time high. Analysts foresee the S&P 500 earning $94.20 in 2008, a new record. "It's a really good investing environment in general right now," an analyst tells Bloomberg. In fact, it was one of the worst in history.
The S&P ended up earning half the amount analysts expected in 2008, and stocks plunged nearly 50%.
Another whoops.
By 2009 gloom was pervasive. Bloomberg lamented "the longest earnings slump since the Great Depression." Analysts expected the S&P 500 to earn $53 a share in 2010, and $63 in 2011.
In reality, the index earned $83 and $96, respectively. Here again, for the last five years you could have been a top performer by taking analysts' earnings estimates and multiplying or dividing them by two.
Can we just admit that no one knows what earnings will do in the future?
Tuesday, July 03, 2012
(Charlie Munger on) ideology
In a May 2007 speech at USC, Charlie Munger said the following about ideology:
“Another thing I think should be avoided is extremely intense ideology because it cabbages up one’s mind; you’ve seen that, and you see it a lot with T.V. preachers, for instance – they’ve all got different ideas about theology and a lot of them have minds that are made of cabbage. But that can also happen with political ideology, and when you’re young it’s easy to drift into loyalties and when you announce that you’re a loyal member and you start shouting the orthodox ideology out, what you’re doing is pounding it in, pounding it in, and you’re gradually ruining your mind. So you want to be very, very careful of this ideology. It’s a big danger… I have what I call an iron prescription that helps me keep sane when I naturally drift toward preferring one ideology over another and that is: I’m not entitled to have an opinion on this subject unless I can state the arguments against my position better than the people who support it. I think only when I’ve reached that state I am qualified to speak. This business of not drifting into extreme ideology is a very, very important thing in life.”
[And since I follow everything Munger says, I am forced to agree..]
Saturday, June 30, 2012
The One Thing
Anand Chokkavelu writes of 100 things he's learned in investing.
Me, I [try to] look for the one main thing. Let me see if it's in the list.
Hmm. Not really. [Well maybe #29 sort of touches on it]
Let's see if I can find an appropriate Warren Buffett quote.
Well I guess there's this one:
If a business does well, the stock eventually follows.
Me, I [try to] look for the one main thing. Let me see if it's in the list.
Hmm. Not really. [Well maybe #29 sort of touches on it]
Let's see if I can find an appropriate Warren Buffett quote.
Well I guess there's this one:
If a business does well, the stock eventually follows.
Saturday, June 23, 2012
How to play the Obamacare ruling
The Supreme Court's highly anticipated ruling on the
constitutionality of "Obamacare" will rattle the stock and bond markets
every bit as much as it shakes up the 2012 presidential contest.
With Americans spending nearly $2.7 trillion a year on medical treatments, health care accounts for 18% of gross domestic product and 12% of the Standard & Poor's 500. In other words, chances are good that your investment portfolio will be affected by the high court's decision.
It looks like the ruling will be handed down the week of June 24, the end of the court's current session. A decision either way could give a broad lift to the health-care sector in the short term, because it would eliminate uncertainty. But soon after, the stocks of various types of companies within health care would most likely follow separate courses. Regardless of whether the law is upheld or struck down or modified, some stocks will get clobbered, some will pop and others will barely budge.
Thursday, June 21, 2012
Larry Ellison is buying Lanai
Hawaii’s sixth-largest island,
Lanai, has been known by different nicknames through the decades — from
the “Pineapple Island” to the “Private Island” and at present “Hawaii’s
Most Enticing Island.” One could soon call it “Ellison Island.”
The third-richest man in
America, Oracle Corp. co-founder and CEO Larry Ellison, is buying Lanai
from fellow billionaire David Murdock for hundreds of millions of
dollars in cash, though the exact price was not disclosed.
Friday, June 15, 2012
my investing bookshelf
I figure since I created my list of dog books, I might as well post the list of investing books that I have on my bookshelf (or somewhere).
Richard Band, Contrary Investing for the 1990s (1989)
Peter Brimelow, The Wall Street Gurus (1986)
Mary Buffett and David Clark, Buffettology (1997)
Charles B. Carlson, Eight $teps To $even Figure$ (2000)
George S. Clason, The Richest Man in Babylon (1989)
James J. Cramer, Mad Money: Watch TV, Get Rich (2006)
James J. Cramer, Stay Mad for Life (2007)
Lawrence Cunningham, The Essays of Warren Buffett (1998)
Pat Dorsey, The Five Rules for Successful Stock Investing (2004)
Charles D. Ellis, The Investor's Anthology (1997)
Mark Fisher, The Instant Millionaire (1993)
Mark Fisher, Millionaire's Secrets (1996)
Norman Fosback, Stock Market Logic (1976)
David and Tom Gardner, The Motley Fool Investment Guide (1996
J. Paul Getty, How To Be Rich (1986)
Robert Hagstrom, The Warren Buffett Way (1994)
Robert Hagstrom, The Warren Buffett Portfolio (1999)
Napoleon Hill, Think and Grow Rich (1983)
Andrew Kilpatrick, Of Permanent Value: The Story of Warren Buffett (1994)
Peter Krass, The Book of Investing Wisdom (1999)
Robert Lichello, How To Make $1,000,000 in the Stock Market (1985)
Janet Lowe, Warren Buffett Speaks (1997)
Roger Lowenstein, Buffett: The Making of an American Capitalist (1995)
Peter Lynch, One Up On Wall Street (1990)
Peter Lynch, Beating The Street (1994)
Peter Lynch, Learn To Earn (1997)
Michael Mauboussin, More Than You Know (2006)
William J. O'Neil, How To Make Money In Stocks (1994)
James P. O'Shaughnessy, What Works On Wall Street (1996)
James Pardoe, How Buffett Does It (2005)
William Poundstone, Fortune's Formula (2006)
Martin Pring, Investment Psychology Explained (1992)
Siimon Reynolds, Thoughts of Chairman Buffett (1998)
John Rothchild, A Fool and his Money (1988)
Howard Ruff, Making Money (1986)
Adam Smith, The Money Game (1967)
Adam Smith, Supermoney (1972)
Thomas J. Stanley and William D. Danko, The Millionaire Next Door (1996)
Madelon DeVoe Talley, The Passionate Investors (1987)
Andrew Tobias, Still! The Only Investment Guide You'll Ever Need (1978)
Andrew Tobias, Getting By on $100,000 a Year (1981)
Andrew Tobias, Money Angles (1985)
Phil Town, Rule #1 (2007)
John Train, The Money Masters (1980)
John Train: The Midas Touch (1988)
John Train, The New Money Masters (1990)
John Train, The Craft of Investing (1994)
Clint Willis, What Do I Do With My Money Now? (2003)
Martin Zweig, Winning On Wall Street (1986)
And on my wanted/reminder list:
Mary Buffett and David Clark, The Tao of Warren Buffett
Joel Greenblatt, The Little Book The Beats The Market
Janet Lowe, Damn Right: Behind the Scenes with Berkshire Hathaway Billionaire Charlie Munger
Charlie Munger, Poor Charlie's Almanack
Peter Sander and Janet Haley, Value Investing for Dummies
*** [8/29/14 via facebook]
A review of 26 books (out of 52)
Thursday, June 07, 2012
successful dividend investors
Dividend investing is as sexy as watching paint dry on the wall.
Defining an entry criteria that selects quality dividend stocks with
rising dividends over time and then patiently reinvesting these
dividends while sitting on your hands is not exciting.
I did some research and uncovered several sucessful successful dividend investors, whose stories provide reassurance that the traits of successful dividend investing I outlined in a previous post are indeed accurate.
Anne Scheiber turned a $5,000 investment in 1944 into $22 million by the time of her death at the age of 101 in 1995. Anne Scheiber worked as an IRS auditor for 23 years, never earning more than $3150/year. The one important lesson she learned auditing tax returns was that the surest way to become rich in America is by accumulating stocks. [8/2/14] [8/16/19]
Grace Groner, who turned a small $180 investment in 1935 into $7 million by the time of her death in 2010. Ms Groner, who worked as a secretary at Abbott Laboratories for 43 years invested $180 in 3 shares of Abbott Laboratories (ABT) in 1935. She then simply reinvested the dividends for the next 75 years. She never sold, but just held on to her shares.
The third dividend investor is Warren Buffett, the Oracle of Omaha himself. In a previous article, I have outlined the reasoning behind my belief that Buffett is a closet dividend investor. He explicitly noted in his 2009 letter that "the best businesses by far for owners continue to be those that have high returns on capital and that require little incremental investment to grow".
Wednesday, June 06, 2012
Ron Paul's portfolio
Last May, Ron Paul filed his financial disclosure form, and The Wall Street Journal enlisted financial analyst William Bernstein to scrutinize his investments.
“Paul’s portfolio isn’t merely different,” said an astonished Journal, “it’s shockingly different.”
Twenty-one percent of his $2.4 to $5.5 million was in real estate, 14 percent in cash. He owns no bonds. Only 0.1 percent is invested in stocks, and Paul bought these “short,” betting the price will plunge. Every other nickel is sunk into gold and silver mining companies.
Bernstein “had never seen such an extreme bet on economic catastrophe,” said the Journal.
“This portfolio,” said Bernstein, “is a half step away from a cellar-full of canned goods and 9-millimeter rounds.”
“You can say this for Ron Paul,” conceded the Journal. “In investing as in politics, (Paul) has the courage of his convictions.”
Indeed, he does. Paul’s investments mirror his belief that the empire of debt is coming down and Western governments will never repay — in dollars of the same value — what they have borrowed.
- seen in Midweek, 1/18/12
Wednesday, May 30, 2012
presidents and the unemployment rate
Looking at the table,
unemployment went down under Reagan, zoomed up under Bush, went down under Clinton, went up under W, and is up under Obama.
However it has gone up only 0.3% under Obama. Where it went up 1.9% under Bush. And 1.1% and 2.5% under W.
Assuming you trust the numbers. And, of course, suspecting the zillions of other factors involved.
Wednesday, May 16, 2012
charts that show inflation is near
the charts begin with the Federal Reserve's aggressive response to the
financial crisis and end with a dramatic increase in the price of
commodities such as corn, oil, and gold. The charts in between
illustrate why the dramatic growth in the money supply has only begun to exert its influence on consumer prices.
Of course, if it's true that higher inflation is on the way, and I believe that it is, then it's important to start thinking about how to inflation-proof your portfolio.
As I discussed previously, the traditional way to do so is to anchor it in tangible assets. You can do this directly through an exchange-traded fund like the SPDR Gold Trust (NYSE: GLD) , or indirectly by investing in companies that produce tangible assets like Molycorp (NYSE: MCP) , a rare earth producer, or Paramount Gold and Silver (NYSE: PZG) , an exploration-stage mining company in Mexico.
A second approach, and the one I prefer, is to invest in consumer goods companies that can pass price increases onto their customers. Coca-Cola (NYSE: KO) and Procter & Gamble (NYSE: PG) are textbook examples of this given the power of their respective brands.
Saturday, April 14, 2012
inflation
Yes, there has been inflation over the last century -- so much that any time inflation is discussed someone feels obligated to point out that a dollar has been devalued by well over 90% in the last century. That's true. But inflation has pushed average wages up by a far greater amount, causing the share of income spent on most consumer goods to plunge. The average household spent 43% of their income on food in 1900, 30% in 1950, and 13% in 2003.
Such shifts are often missed when discussing inflation and wealth. At an investment conference two years ago, Berkshire Hathaway (NYSE: BRK-B ) Vice Chairman Charlie Munger remarked: "I remember the $0.05 hamburger and a $0.40-per-hour minimum wage, so I've seen a tremendous amount of inflation in my lifetime. Did it ruin the investment climate? I think not."
Later that day, a questioner asked Munger about inflation's "devastation" over the past half-century. In 1950, a corned-beef sandwich at a local diner cost $0.55, the questioner noted. Today it's $10. How can a country be anything but a failure when its currency loses 95% of its value to inflation, he wondered.
"If you think the past half-century was bad, you will have serious problems in life," Munger replied. "Despite inflation, we've been a huge success. Real GDP has grown 2% per year per capita. That's fantastic. The period you describe as miserable was a tremendous time for the American economy. You've described success."
Friday, April 13, 2012
avoiding value traps: four questions
Investing is a curious balance between art and science; value investors, who by their nature are generally contrarian, almost always find themselves debating whether a security is a steal or a value trap. At the same time, if that company is well known, it is likely being ridiculed in the media and showered with contempt in the blogosphere. This is the point of maximum pessimism; and as the great investor John Templeton noted, this is the best time to buy.
what I want to address is how to avoid value traps. While this list is in no way complete, it covers a few of the key questions that I believe should be asked before attempting to catch a falling knife:
1) What are the odds that this company will not be around ten years from today? – As I noted in my previous article “Kill the Company,” this is the first question Buffett will always ask: Is there any chance that a significant amount of my capital could be subject to catastrophe risk? As Alice Schroeder noted, if the answer is yes, he just stops thinking; this is a good example to follow.
2) What is the company’s sustainable competitive advantage? – In my mind, this is essentially the same thing as No. 1: What does this company do that all but guarantees its existence 10, 20 and 50 years from now? For Coca-Cola (KO), it delivers a product with unmatched brand equity (partly due to significant economies of scale) via an unrivaled distribution network; in addition, it has levered this success to enter new categories (juices, teas, sports drinks, etc.) in order to all but guarantee its continued growth even if the shift away from CSDs experienced in the U.S. continues in the future.
3) Does the company have the financial strength to ride out a rough patch?).
... Nokia (NOK); while the company has gotten clobbered by Apple’s (AAPL) iPhone and Google’s (GOOG) Android operating system, they are fine from a financial perspective. Even after losing more than 1 billion euros last year, the company has net cash of 5 billion euros, leaving them plenty of time to right the ship (now that we abandoned that burning oil rig, right Mr. Elop?) before the balance sheet becomes an issue.
4) Would you LOVE to see the stock fall 50%? – For me, this is the ultimate test for an investment. If you can look at a company’s competitive position within an industry and know that you would love to buy more at half of today’s price regardless of the short-term noise, that’s a good sign in my book (I've been begging for many to do some since I missed out in 2009, but so far, no gravy). If this isn’t true, there are two likely culprits: Either you question the long-term sustainability of the business, or you don’t understand enough about the company to feel comfortable with bouts of volatility. Either way, its probably a sign that you should move on to the next opportunity.
Friday, March 23, 2012
Howard Marks: Déjà Vu All Over Again
[3/23/12 - VE1 passed along the latest memo from Howard Marks.]
... If I were asked to name just one way to figure out whether something’s a bargain or not, it would be through assessing how much optimism is incorporated in its price.
No matter how good the fundamental outlook is for something, when investors apply too much optimism in pricing it, it won‟t be a bargain. That was the story of the Internet bubble; the Internet was expected to change the world, and it did, but when the optimism surrounding it proved to have been excessive, stock prices were decimated.
Conversely, no matter how bad the outlook is for an asset, when little or no optimism is incorporated in its price, it can easily be a bargain capable of providing outsized returns with limited risk.
Even with a bad “story,” the price of an asset is unlikely to decline (other than perhaps in the very short term) unless the story deteriorates further or the optimism abates. And if there‟s no optimism built into its price, certainly the latter can‟t happen.
Marks is the chairman of Oaktree Capital. His memos dating back to 1991 are accessible from the website.
He's also wrote a book called The Most Important Thing in which he sort of he puts together and polishes up his collection of memos over the years.
*** [9/10/17]
There They Go Again ... Again / Yet again?
Friday, March 09, 2012
Charlie Rose interviews Seth Klarman
Charlie Rose interviews Seth Klarman. The first 18 minutes is about "Facing History", his nonprofit organizaiton. Then they got to the book of "Margin of Safety". Klarman's view of Warren Buffett's three stages of investing: "Warren evolves three stages". He said he is still in the first stage.
1. Buy cigarbutts at good prices
2. Buy great companies at great prices
3. Buy great companies at so so prices.
1. Buy cigarbutts at good prices
2. Buy great companies at great prices
3. Buy great companies at so so prices.
Thursday, March 08, 2012
the 11 market-cap leaders of the past 86 years
In recent weeks, Apple (Nasdaq: AAPL) has firmly established its market capitalization leadership among the companies of the S&P 500. It has surged past ExxonMobil (NYSE: XOM) into the No. 1 position by a considerable margin. Surprisingly, the crowning of a new market cap leader is far more unusual than you might think.
There have been only 11 distinct leaders since 1926, which makes the emergence of a new one about as frequent as an American war (we've had around 10 of those since then, by my count).
There have been only 11 distinct leaders since 1926, which makes the emergence of a new one about as frequent as an American war (we've had around 10 of those since then, by my count).
Saturday, March 03, 2012
high risk, low reward
In an absolute sense, it's of course true that the more money investors put at risk, the more they'll gain if their investments increase in value. However, with the kind of risk that's become synonymous with volatility in investment argot, the opposite has been true. On average, high-beta investments--those whose prices have swung wider than an index over a given period of time--have historically generated worse returns than less-volatile alternatives.
The pattern has been persistent. This study, which appeared last year in the CFA Institute's Financial Analysts Journal, found that between 1968 and 2008, a portfolio comprising the least-volatile quintile of the market's 1000 largest stocks swamped the most-volatile quintile over the course of 40 years. And in this explanation of why boring can be beautiful, Morningstar ETF analyst Samuel Lee cites the work of Lasse Pedersen and Andrea Frazzini. In this 2011 paper, the duo find better risk-adjusted returns resulting from "betting against beta" across a broad range of asset types and geographic boundaries over a 50-year time frame.
History doesn't always repeat. Over a lengthy stretch of time, though, investors have fared better by taking on less risk, not more.
Wednesday, February 29, 2012
should you wait for a crash?
before buying?
Geoff Gannon gives us his answer:
Take your time.
But don’t wait for a market crash.
Just wait for an obviously wonderful business selling for the kind of price a normal stock sells for in normal times.
[Looking back on some of my picks, I bought some good companies (or what I thought were good companies) initially too high, but then bought more as they declined. For example, Costco (which has worked out). Walgreen (which hasn't so far).]
Dow breaks 13000
Bolstered by rising consumer confidence and a decline in oil prices, the Dow Jones industrial average closed above 13,000 for the first time in nearly four years on Tuesday.
The rising stock market is a sign that investors are feeling more confident that the economy will be improving for at least the short-term. And that could have ramifications beyond Wall Street.
“Higher stock prices might lead people to be more optimistic about the economy,” said Allan Timmerman, finance professor at the University of California, San Diego.
But Timmerman warned that the market “doesn’t have the best track record for predicting economic growth, even if it is a very noisy indicator.”
The Dow, which had been flirting with the 13,000 mark for the past week, rose 23.61 points on Tuesday, or 0.2 percent, to close at 13,005.12.
The Dow last closed above 13,000 in May 2008, four months before the fall of the Lehman Brothers investment bank and the worst of the global financial crisis.
The other major indexes sit at multi-year highs as well. The Standard & Poor's 500 closed Tuesday at its highest level since June 2008, and the Nasdaq has not traded so high since December 2000, during the bursting of the bubble in technology stocks.
***
[Looking at bigcharts.com, the all-time high is slightly north of 14K set in 2007. It looks that it's about doubled from the March 09 low.]
(However, adjusting for dividends, it DID hit an all-time high.)
A class on Value Investing
Hi Geoff,
Assuming someone had the temperament, interest and work ethic to be a good investor. What would you prescribe as a curriculum?
Which books, articles, shareholder letters, blogs, websites, etc. If you were going to have an extensive class on value investing, what would the materials list look like?
Thanks,
Ryan
Here is what I would make required reading:
· Warren Buffett’s Letter to Shareholders (1977-Present)
· Warren Buffett’s Letter to Partners (1959-1969)
· The Snowball: Warren Buffett and the Business of Life
· Buffett: The Making of An American Capitalist
· Poor Charlie’s Almanack
· Common Stocks and Uncommon Profits (by Phil Fisher)
· The Interpretation of Financial Statements (by Ben Graham)
· The Intelligent Investor (1949 Edition)
· Security Analysis (1940 Edition)
· Benjamin Graham on Investing
· Benjamin Graham: The Memoirs of the Dean of Wall Street
· One Up on Wall Street (by Peter Lynch)
· Beating the Street (by Peter Lynch)
· You Can Be a Stock Market Genius (by Joel Greenblatt)
· The Little Book That Beats the Market (by Joel Greenblatt)
· There’s Always Something to Do (about Peter Cundill)
· The Money Masters
· Money Masters of Our Time
· Hidden Champions of the Twenty-First Century
· Jim Collins Books (Built to Last, Good to Great, How the Mighty Fall, and Great by Choice)
· Distant Force (about Henry Singleton)
· Kuhn’s The Structure of Scientific Revolutions and The Essential Tension
Part of the class would require reading some material about extreme stock market conditions like:
· The Big Short
· Too Big to Fail
· This Time is Different
· When Genius Failed
· The Panic of 1907
This part of the class would revolve around contemporary sources. Students would read newspaper articles from the various crashes. They’d also read newspapers around the time of the various market bottoms. Historical case studies should be based on sources that were present and available to investors, CEOs, etc., at the time. So, if you’re studying an investment Ben Graham made in 1942 – you should be using The New York Times archives to find articles printed in 1942 and you should be getting your data from a Moody’s Manual from 1942.
This is critical.
And many people have never done it. Many investors have never gone back through old Moody’s Manuals, newspaper articles, etc. If you think you know enough about 1929 and yet you’ve never read something written in 1929 – you’re idea of knowing is too intellectual and external. Knowing is understanding what the paper looked like every morning to folks who were as blind to the future as you are now. You have to internalize what it feels like to be in the middle of all that.
***
[Assuming that Geoff has done all this (impressive already to me), I wonder how successful he actually is at investing? Here's a hint, he moved to Texas and is now working full-time for gurufocus. (So he still "works" for a living.)
Tuesday, February 21, 2012
Walter Schloss
Walter Schloss, the money manager who earned accolades from Warren Buffett (BRK/A) for the steady returns he achieved by applying lessons learned directly from the father of value investing, Benjamin Graham, has died. He was 95.
He died on Feb. 19 at his home in Manhattan, according to his son, Edwin. The cause was leukemia.
From 1955 to 2002, by Schloss’s estimate, his investments returned 16 percent annually on average after fees, compared with 10 percent for the Standard & Poor’s 500 Index. (SPX) His firm, Walter J. Schloss Associates, became a partnership, Walter & Edwin Schloss Associates, when his son joined him in 1973. Schloss retired in 2002.
Buffett, a Graham disciple whose stewardship of Berkshire Hathaway Inc. has made him one of the world’s richest men and most emulated investors, called Schloss a “superinvestor” in a 1984 speech at Columbia Business School. He again saluted Schloss as “one of the good guys of Wall Street” in his 2006 letter to Berkshire Hathaway shareholders.
“Walter Schloss was a very close friend for 61 years,” Buffett said yesterday in a statement. “He had an extraordinary investment record, but even more important, he set an example for integrity in investment management. Walter never made a dime off of his investors unless they themselves made significant money. He charged no fixed fee at all and merely shared in their profits. His fiduciary sense was every bit the equal of his investment skills.”
***
America lost an investing icon over the weekend; although few individuals outside the small fraternity of Graham and Doddsville are privy to the unique brilliance which Walter Schloss possessed. That fact is almost as sad as his passing.
The genius of Mr. Schloss was rooted in simplicity and tempered with patience. But above all, his stunning success was a direct result of his fundamental sense of value and his practice of self-reliance. You see, Schloss never relied on anyone but himself to achieve his stellar results. He never cared what others were buying and he never lost heart if the overall market outperformed his holdings in the short term. In the long term, he waxed the overall market for decades and left virtually every other investment and fund manager in his wake.
***
Walter Schloss – like Warren Buffett – was a student of Ben Graham. However, Schloss took a more arithmetical approach to investing. Schloss remained more quantitative than Warren Buffett. He was never quite comfortable with the Phil Fisher’s scuttlebutt approach. In this way, Schloss stuck closer to Ben Graham’s teachings than Warren Buffett did.
This is what Warren Buffett said of Walter Schloss in his 2006 letter to shareholders:
“Walter did not go to business school, or for that matter, college. His office contained one file cabinet in 1956; the number mushroomed to four by 2002. Walter worked without a secretary, clerk or bookkeeper, his only associate being his son, Edwin…Walter and Edwin never came within a mile of inside information. Indeed, they used ‘outside’ information only sparingly, generally selecting securities by certain simple statistical methods Walter learned while working for Ben Graham.”
And, finally, this is what Warren Buffett said of Walter Schloss in 1984:
“… He knows how to identify securities that sell at considerably less than their value to a private owner… He simply says, if a business is worth a dollar and I can buy it for 40 cents, something good may happen to me. And he does it over and over and over again. He owns many more stocks than I do – and is far less interested in the underlying nature of the business; I don't seem to have very much influence on Walter. That's one of his strengths; no one has much influence on him.”
Sunday, February 19, 2012
Gold relative to S&P 500 (and comments)
In January 1980, gold reached 6x the S&P 500. It is currently 1.4. (Though well above the low set around 2000.)
The instructions on using the comments section is particular notable..
Comments
Please use the comments to demonstrate your own ignorance, unfamiliarity with empirical data, ability to repeat discredited memes, and lack of respect for scientific knowledge. Also, be sure to create straw men and argue against things I have neither said nor even implied. Any irrelevancies you can mention will also be appreciated. Lastly, kindly forgo all civility in your discourse . . . you are, after all, anonymous.
[via pbo]
Tuesday, February 14, 2012
Obama's proposed budget
President Barack Obama released his 2013 budget proposal yesterday. "This Budget is a step in the right direction," he wrote in the introduction. "And I hope it will help serve as a roadmap for how we can grow the economy, create jobs, and give Americans everywhere the security they deserve."
But that's where the easy reading ends. The rest of the proposal is a mammoth 251 pages of tables, charts, footnotes, appendixes, assumptions, and calculations. Some items are mandatory, others discretionary. Some departments are sub-departments of other departments, making it easy to double count and undercount. Phrases like "discretionary cap adjustment" are used liberally. It's not written with the average American in mind.
After reading about a dozen articles analyzing the budget, I was miffed that none offered a simple table showing how much money the proposal wants to spend, and where. So I did just that, with a little context:
As a percentage of GDP, safety-net programs like Social Security, Medicare, and income security are all above the long-term average -- due mainly to a weak economy and an aging population -- while defense spending is actually below average. All other budget categories are about in line with historic norms, if not below. That's an important point that often goes misunderstood: The majority of government spending that is currently in excess of historic averages is on programs that are very popular with voters, like Social Security. As The New York Times reported this week, about half of Americans live in a household that receives government benefits.
So that's spending. What about taxes? Here's what Obama proposes:
Total taxes are as a percentage of GDP will still be below the historic average in 2013 -- and even that relies on an assumption that various tax proposals like allowing the Bush tax cuts on high-income earners will be allowed to expire. Politically, that's probably not going to happen. And without those reforms, deficits will be much wider. Current tax revenue is far below normal, totaling 15.4% of GDP. If tax revenue were at a historic norm, the budget deficit would be $400 billion lower this year, erasing about one-third of the shortfall.
Coddling the Super-Rich?
In August of 2011 legendary investor Warren Buffett wrote an editorial in the New York Times entitled, “Stop Coddling the Super-Rich.” In the editorial Buffett argued that the rich have not been asked to pay their fair share and should have their taxes increased. What really resonated with many was Buffett’s argument that he should not be paying a lower tax rate than his secretary. President Obama quickly adopted the phrase and used it in support of his position of increasing taxes on the upper class.
In the editorial Buffett asserts that he paid a 17.4% tax rate in 2010 while others in his office averaged a 36% rate. Instead of shock and/or anger, the numbers triggered a red flag for me. The U.S. has a progressive taxation system - rates progress higher as your income increases. Buffett’s rate was unusually low. he average effective income tax rate for a person making over $10,000,000 in 2009 was 27% (see chart below). I also knew that a 36% average effective rate seemed unusually high. Something was amiss.
[oddly no comments yet]
***
Warren Buffett isn’t the only rich guy who wants to higher taxes on the rich. [who's writing this, Cesar Millan?]
A new survey from Spectrem Group found that 68% of millionaires (those with investments of $1 million or more) support raising taxes on those with $1 million or more in income. Fully 61% of those with net worths of $5 million or more support the tax on million-plus earners.
Buffett, as you might recall, has proposed raising taxes on million-plus earners, saying the ultra-rich pay lower rates than everyday workers.
Rich people’s opinions of Buffett remain fairly positive in the wake of his tax-me-more crusade. More than a third of millionaires and ultra-high-net-worths said they have a more positive opinion of Buffett after his tax proposal. Only 19% of millionaires and 22% of the $5 million -plus group said they had a more negative opinion of him after the proposal.
Saturday, February 11, 2012
why stocks beat gold and bonds
The second major category of investments involves assets that will never produce anything, but that are purchased in the buyer's hope that someone else -- who also knows that the assets will be forever unproductive -- will pay more for them in the future. Tulips, of all things, briefly became a favorite of such buyers in the 17th century.
The major asset in this category is gold, currently a huge favorite of investors who fear almost all other assets, especially paper money (of whose value, as noted, they are right to be fearful). Gold, however, has two significant shortcomings, being neither of much use nor procreative. True, gold has some industrial and decorative utility, but the demand for these purposes is both limited and incapable of soaking up new production. Meanwhile, if you own one ounce of gold for an eternity, you will still own one ounce at its end.
What motivates most gold purchasers is their belief that the ranks of the fearful will grow. During the past decade that belief has proved correct. Beyond that, the rising price has on its own generated additional buying enthusiasm, attracting purchasers who see the rise as validating an investment thesis. As "bandwagon" investors join any party, they create their own truth -- for a while.
Today the world's gold stock is about 170,000 metric tons. If all of this gold were melded together, it would form a cube of about 68 feet per side. (Picture it fitting comfortably within a baseball infield.) At $1,750 per ounce -- gold's price as I write this -- its value would be about $9.6 trillion. Call this cube pile A.
Let's now create a pile B costing an equal amount. For that, we could buy all U.S. cropland (400 million acres with output of about $200 billion annually), plus 16 Exxon Mobils (the world's most profitable company, one earning more than $40 billion annually). After these purchases, we would have about $1 trillion left over for walking-around money (no sense feeling strapped after this buying binge). Can you imagine an investor with $9.6 trillion selecting pile A over pile B?
A century from now the 400 million acres of farmland will have produced staggering amounts of corn, wheat, cotton, and other crops -- and will continue to produce that valuable bounty, whatever the currency may be. Exxon Mobil (XOM) will probably have delivered trillions of dollars in dividends to its owners and will also hold assets worth many more trillions (and, remember, you get 16 Exxons). The 170,000 tons of gold will be unchanged in size and still incapable of producing anything. You can fondle the cube, but it will not respond.
Admittedly, when people a century from now are fearful, it's likely many will still rush to gold. I'm confident, however, that the $9.6 trillion current valuation of pile A will compound over the century at a rate far inferior to that achieved by pile B.
-- by Warren Buffett (via gurufocus)
TRON is ready to run
"TRON IS READY TO RUN -- Rarely does an opportunity so ripe present itself! The possibility for huge gains is immense -- Read below"
Toron Inc is (TICKER: TRON) poised for huge growth. Many experts and Wall Street Professionals are stating that it could run as high as 7.50 in the next 60 days. If that is true (which we believe it could be), the gains would be even bigger than our last 3,000 percent gainer.
Toron Inc is (TICKER: TRON) poised for huge growth. Many experts and Wall Street Professionals are stating that it could run as high as 7.50 in the next 60 days. If that is true (which we believe it could be), the gains would be even bigger than our last 3,000 percent gainer.
Monday, February 06, 2012
Facebook by the numbers
Unless you spent the better part of the week under a rock, you probably heard that Facebook, the game-changing social media giant, officially filed its paperwork to go public this week. Founded in 2004 by Mark Zuckerberg, the company proceeded to ignite a social phenomenon that drastically altered the way that people interact and connect.
And while its social implications are already well documented, its clout as a business and investment have largely gone unknown to the general public (although some very wealthy investors have gotten their hands on shares in the meantime). The filing gave most observers their first real peek into the real business that is Facebook, revealing some interesting figures at the same time, which we break down here in our most recent infographic -- Facebook's Amazing IPO By The Numbers.
Here are some highlights:
Valuation has gone from 0 in 2004 to $100 billion.
The second most visited site on the internet, next to Google. 6.2 billion to 4.8 billion monthly visitors.
24% owned by Mark Zuckerberg.
Zuckerberg figures to make $24 billion in the IPO.
P/E ratio of 100 (compared to 13 for Apple) [or maybe 150?]